This note provides context on the latest escalation in the Middle East based on the most recently available information.
Summary
- A joint U.S.-Israeli strike killed the Iranian Supreme Leader and other senior officials over the weekend, prompting Iran to retaliate across the region and effectively close the Strait of Hormuz. Markets reacted in the expected risk-off fashion, with oil and gold prices surging while equities sold off.
- History shows markets often sell off at the onset of conflict but recover as uncertainty clears, with the 1973–74 oil embargo the notable exception due to its sustained, structural inflation shock.
- Iran’s direct oil output is modest, but a prolonged Hormuz disruption would act as a tax on global growth, hitting China hardest while leaving the U.S., now a major producer, comparatively more balanced.
- In a midterm year with low approval ratings for Donald Trump, a sustained rise in gasoline prices would be politically costly, incentivizing a bounded rather than open-ended conflict.
- History suggests markets typically absorb geopolitical shocks over time; we believe investors should stay anchored to their long-term plan.
What Happened
Over the weekend, U.S. and Israeli forces launched a joint military operation, striking targets across Iran. Iran’s Supreme Leader was killed, along with several senior officials. Regional tensions have escalated, prompting Iranian retaliation across parts of the Middle East. Since Saturday, Iran has targeted U.S. military installations and regional energy and civilian infrastructure, including airports in Dubai and Bahrain.
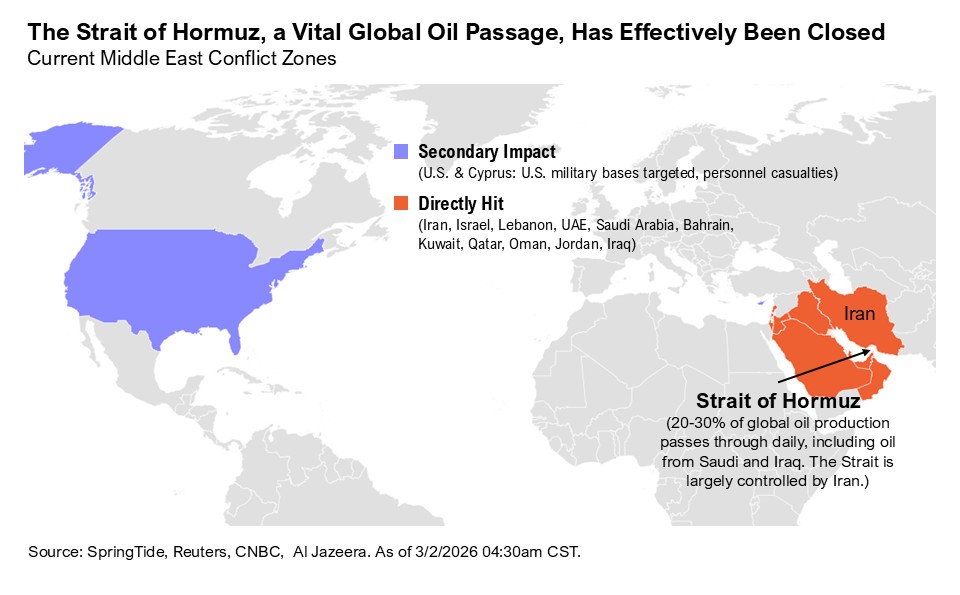
Iran has announced the effective closure of the Strait of Hormuz, the narrow maritime corridor between Iran and Oman through which roughly 20% of global oil and about 25% of global LNG flows daily (the Iranian Revolutionary Guard on Saturday told ships passage through the Strait is “not allowed”). Tanker traffic has largely halted amid security and insurance concerns.
The global response has been swift. China and Russia have called emergency UN Security Council meetings, while Iran has invoked Article 51 (self-defense). President Trump has signaled continued military pressure while also leaving open the possibility of talks.
In the very short term, this shock has pushed oil and gold higher and pressured risk assets. West Texas Intermediate (WTI) crude oil has surged more than 10% over the weekend and held most of those gains through this morning, gold has rallied 4%, and equities have declined. The key question for markets is not what happens militarily in the short term, but whether this conflict durably alters global growth, inflation, or central bank policy.
Historical Perspective
History shows that markets tend to react sharply to the uncertainty around major geopolitical shocks, but the economic impact is often more limited than headlines imply.
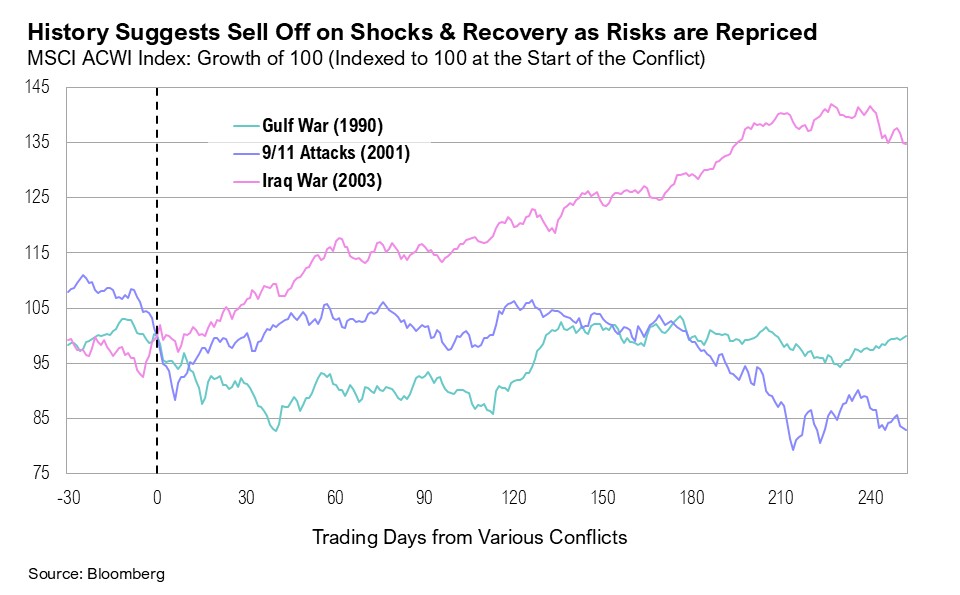
Gulf War (1990 – 1991)
After Iraq invaded Kuwait in August 1990, the S&P 500 fell roughly 10–17% as oil prices surged and recession fears mounted. Once the U.S.-led air campaign began in January 1991 and uncertainty narrowed, oil prices declined sharply and markets recovered, finishing the year more than 20% above pre-war levels.
9/11 Attacks (2001)
After reopening on September 17, the S&P 500 fell approximately 11–12% in one week. Those specific losses were recovered within months as the acute shock faded, though the broader tech-driven bear market persisted.
Iraq War (2003)
In the weeks leading up to the March 2003 invasion, equities were weak amid geopolitical anxiety and the lingering effects of the dot-com bust. Once hostilities formally began, markets bottomed and rallied, with double-digit returns over the following 12 months as uncertainty receded.
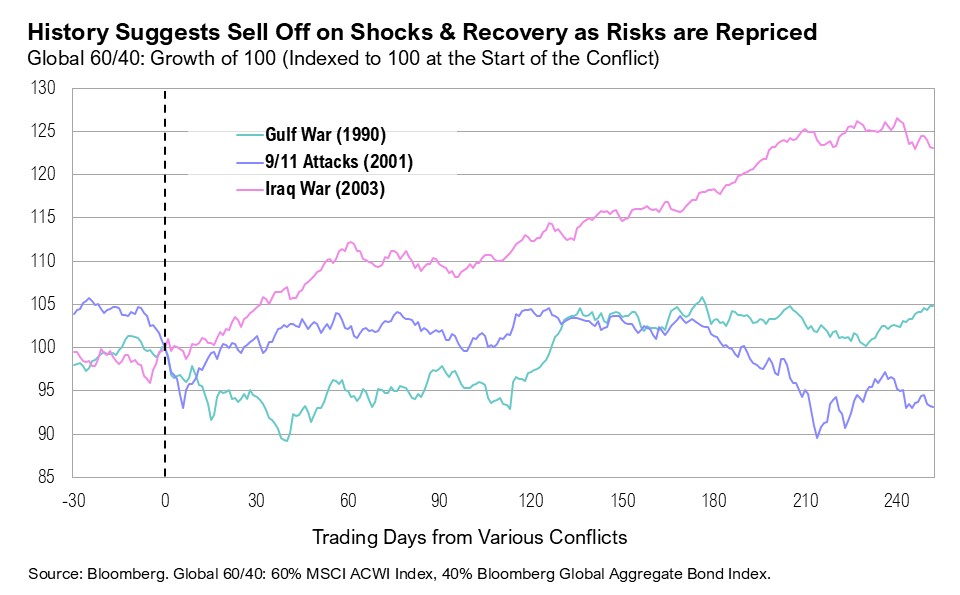
The pattern with the above examples is not that wars are “good” for markets—they are not—but that markets are forward-looking and often adjust quickly once the probable economic range of outcomes becomes clearer. In many cases, the initial market reaction to conflict has been more severe than the eventual economic damage. Based on the above three examples, the chart below shows how, historically, markets tend to sell off sharply on geopolitical shocks, then recover as risks are absorbed and repriced.
Historical performance of the MSCI All Country World Index (a proxy for global stocks) during the three major U.S.-led conflicts in the Middle East referenced above:
Historical performance of a Global 60/40 (stocks and bonds) portfolio during the three major U.S.-led conflicts in the Middle East referenced above:
While most conflicts have produced sharp but ultimately temporary market dislocations, there are important cautionary cases.
Yom Kippur War & the 1973 – 1974 Oil Shock
The 1973 oil embargo is the classic structural energy shock. At that time, the U.S. was heavily dependent on imported oil. When OPEC curtailed exports and crude prices roughly tripled, the result was sustained inflation, recession, and a protracted bear market in which the S&P 500 reached a 48% drawdown.
Those conditions (heavy import dependence, limited domestic production flexibility, and a less diversified economy) made the 1970s uniquely vulnerable to the energy shock in a way that differs meaningfully from today’s more energy-abundant, more diversified U.S. economy, even if a conflict-driven spike in oil prices would still be painful.
Iran’s Global Importance & the China Link
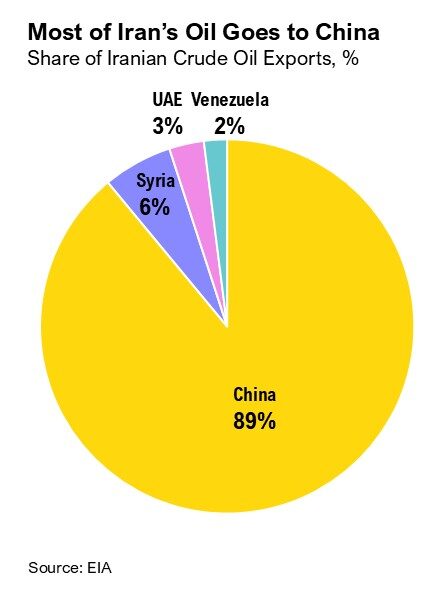
Iran is geopolitically significant, but economically smaller than the attention it receives. Iran accounts for a low single digit share of global oil production, much of which is exported to Asia, particularly China. The larger risk to the global economy is not Iran’s domestic output, but the possibility of prolonged disruption in the Strait of Hormuz.
Even there, the impact is nuanced:
- A temporary closure or effective shut-in via insurance and shipping risks could push oil prices sharply higher and act like a tax on global growth.
- A sustained disruption would likely hit Asian importers hardest, as nearly 84% of crude and 83% of LNG flowing through Hormuz goes to Asia, especially China, India, Japan, and South Korea.
For the U.S., which has become a major energy producer and exporter, the direct economic damage from higher oil prices is more balanced: households pay more at the pump, but U.S. energy producers benefit and domestic production responds over time.
China is Iran’s largest energy customer and a critical end destination for oil transiting the Strait of Hormuz. A sustained disruption would pressure oil prices and directly challenge China’s energy security and economic stability while raising the risk of broader U.S.–China spillover.
Policy Backdrop in a Midterm Year
In a midterm year, markets are highly attuned to how U.S. policy responds to conflict, especially when the president’s domestic standing is already fragile and voters are focused on the cost of living. Recent polling shows President Trump’s approval rating in the mid-30s and only limited public support for expanded military action against Iran, with roughly a quarter of Americans in favor and about half opposed. A prolonged conflict that drives oil and gasoline prices sharply higher would likely be unpopular and could undercut a core political message built around lower inflation and cheaper gas, giving the administration a clear incentive to seek a bounded, shorter-lived outcome.
From a market perspective, two points matter:
- U.S. national defense strategy has long recognized the Strait of Hormuz as a critical maritime chokepoint, and U.S. and allied naval forces are structured to keep it open where possible.
- Market impact will hinge less on rhetoric and more on whether higher oil prices feed persistently into core inflation and forces central banks to delay or reverse their easing cycles.
So far, even with higher tensions, markets have historically tended to take such episodes ‘in stride’ when they conclude that the core economic and policy path remains intact.
Positioning & Looking Forward
Periods like this are unsettling. Headlines are dramatic, and the humanitarian stakes are real. At the same time, markets have a long history of absorbing geopolitical shocks, repricing risk, and moving on. The most resilient approach for investors is to stay anchored to their long-term plan, recognize that volatility is a feature, not a bug, of investing, and act patiently and in a disciplined manner rather than reactively.
Our portfolios are deliberately constructed with the expectation that unpredictable events—wars, elections, and policy shocks—will occur. They already include assets designed to help mitigate volatility in periods like this, including short-term bonds, gold, and other diversifiers.
In that context, the most important decision is often what not to do. At this stage, we have not seen enough to justify major changes; rather, we would look to use any meaningful volatility as an opportunity to selectively add to risk assets where fundamentals support it.
Citations
- https://www.reuters.com/business/energy/saudi-aramco-shuts-ras-tanura-refinery-after-drone-strike-source-says-2026-03-02/
- https://www.reuters.com/world/iran-crisis-live-explosions-tehran-israel-announces-strike-2026-02-28
- https://edition.cnn.com/world/live-news/iran-israel-us-attack-03-02-26-intl-hnk
- https://edition.cnn.com/2026/02/28/middleeast/dubai-airport-uae-iran-attacks-intl-hnk
- https://www.proshares.com/browse-all-insights/insights-commentary/quick-take-gulf-conflicts-and-markets
- https://asiatimes.com/2020/01/how-stock-markets-react-to-conflicts-wars/
- https://www.hennionandwalsh.com/insights/stock-market-reactions-to-war-and-terrorist-attacks-a-historical-analysis
- https://www.bloomberg.com/news/articles/2003-03-19/stocks-end-with-small-gains
- https://www.chicagofed.org/publications/chicago-fed-letter/1994/october-86
- https://www.cfr.org/timelines/oil-dependence-and-us-foreign-policy
- https://www.federalreservehistory.org/essays/oil-shock-of-1973-74
- https://www.barrons.com/articles/us-iran-war-oil-prices-0b32fd0a
- https://www.csis.org/analysis/if-trump-strikes-iran-mapping-oil-disruption-scenarios
- https://www.cnbc.com/2026/02/28/markets-brace-for-impact-following-us-military-strikes-against-iran.html
- https://www.atlanticcouncil.org/dispatches/experts-react-how-the-us-war-with-iran-is-playing-out-around-the-middle-east/
Index Definitions
The S&P 500 Index is widely regarded as the best single gauge of the United States equity market. It includes 500 leading companies in leading industries of the U.S. economy. The S&P 500 focuses on the large cap segment of the market and covers approximately 75% of U.S. equities.
The Bloomberg Barclays U.S. Aggregate Index represents securities that are SEC-registered, taxable, and dollar denominated. The index covers the U.S. investment grade fixed rate bond market, with index components for government and corporate securities, mortgage pass-through securities, and asset-backed securities. Duration is roughly 5 years.
The Bloomberg U.S. Corporate High Yield Bond Index measures the USD-denominated, high yield, fixed-rate corporate bond market. Securities are classified as high yield if the middle rating of Moody’s, Fitch and S&P is Ba1/BB+/BB+ or below. Bonds from issuers with an emerging markets country of risk, based on the indices’ EM country definition, are excluded.
The Russell 2000® Index measures the performance of the small-cap segment of the US equity universe. It includes approximately 2000 of the smallest US equity securities in the Russell 3000 Index based on a combination of market capitalization and current index membership. The Russell 2000 Index represents approximately 10% of the total market capitalization of the Russell 3000 Index. Because the Russell 2000 serves as a proxy for lower quality, small cap stocks, it provides an appropriate benchmark for RMB Special Situations.
The U.S. Dollar Index is used to measure the value of the dollar against a basket of six foreign currencies: the euro, Swiss franc, Japanese yen, Canadian dollar, British pound, and Swedish krona.
MSCI U.S. REIT Index is a free float-adjusted market capitalization weighted index that is comprised of equity Real Estate Investment Trusts (REITs). The index is based on the MSCI USA Investable Market Index (IMI), its parent index, which captures the large, mid and small cap segments of the USA market. With 150 constituents, it represents about 99% of the US REIT universe and securities are classified under the Equity REITs Industry (under the Real Estate Sector) according to the Global Industry Classification Standard (GICS®), have core real estate exposure (i.e., only selected Specialized REITs are eligible) and carry REIT tax status.
Disclaimers
*Source: MSCI.MSCI makes no express or implied warranties or representations and shall have no liability whatsoever with respect to any MSCI data contained herein. The MSCI data may not be further redistributed or used as a basis for other indexes or any securities or financial products. This report is not approved, endorsed, reviewed or produced by MSCI. None of the MSCI data is intended to constitute investment advice or a recommendation to make (or refrain from making) any kind of investment decision and may not be relied on as such.
The opinions and analyses expressed in this newsletter are based on Curi Capital, LLC’s (“Curi Capital”) research and professional experience are expressed as of the date of our mailing of this newsletter. Certain information expressed represents an assessment at a specific point in time and is not intended to be a forecast or guarantee of future results, nor is it intended to speak to any future time periods. Curi Capital makes no warranty or representation, express or implied, nor does Curi Capital accept any liability, with respect to the information and data set forth herein, and Curi Capital specifically disclaims any duty to update any of the information and data contained in this newsletter. The information and data in this newsletter does not constitute legal, tax, accounting, investment or other professional advice. Returns are presented net of fees. An investment cannot be made directly in an index. The index data assumes reinvestment of all income and does not bear fees, taxes, or transaction costs. The investment strategy and types of securities held by the comparison index may be substantially different from the investment strategy and types of securities held by your account.