Summary
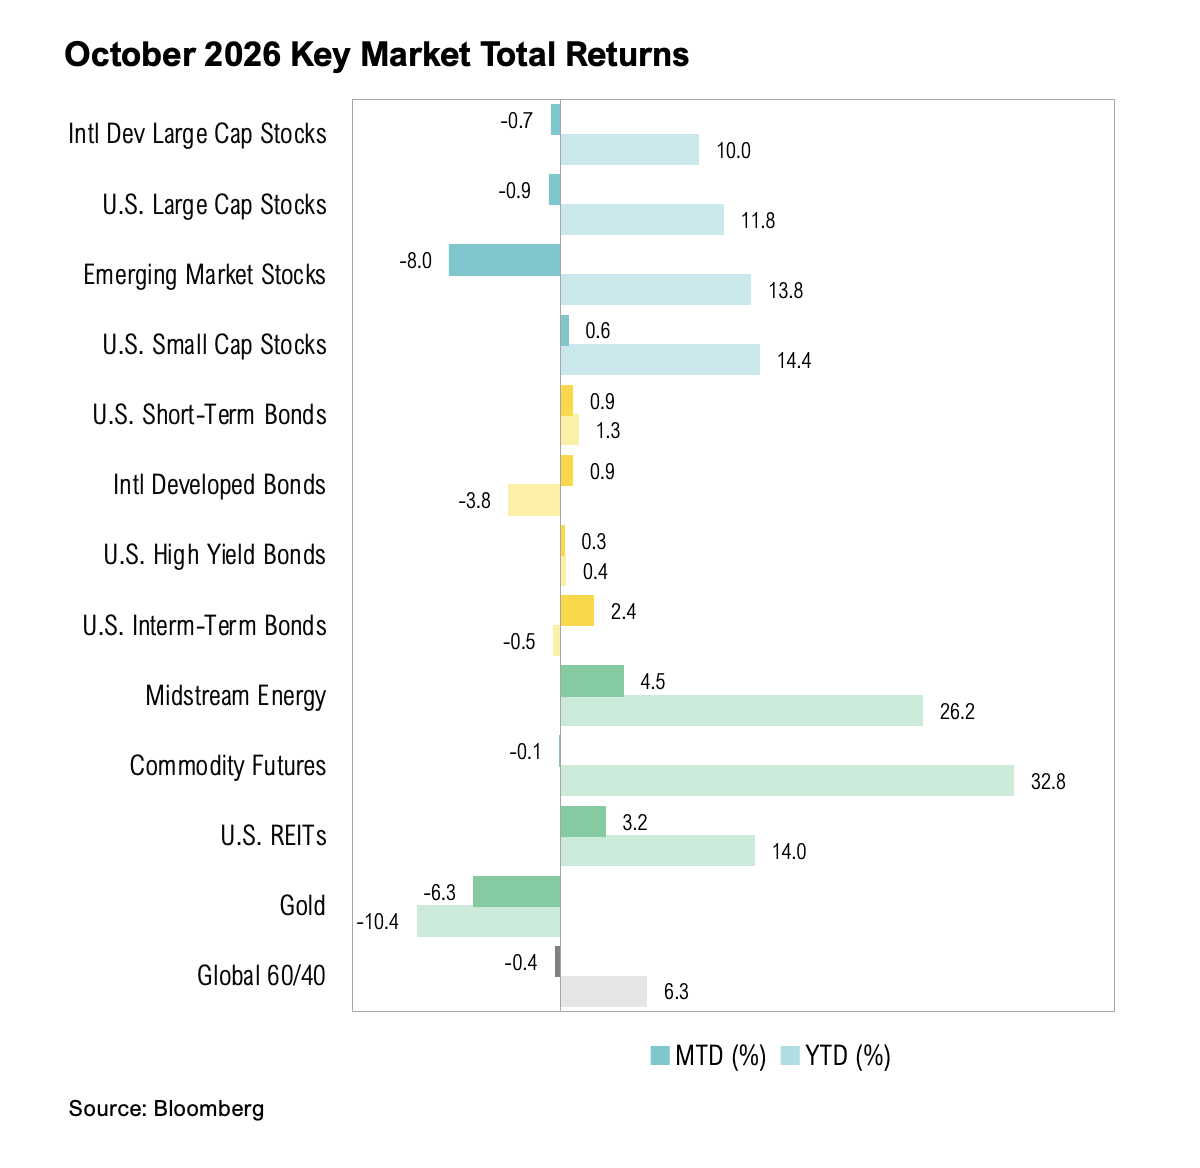
- U.S. large-cap stocks, as measured by the S&P 500 Index, declined 0.9% in October, while the small-cap Russell 2000 Index rose 0.6%.
- The Russell 1000© Value, a proxy for large-cap value stocks, outperformed the Russell 1000© growth by 11%, the third-largest monthly gap in value’s favor since 2000.
- The Federal Reserve decided to keep interest rates unchanged as it seeks additional economic data prior to its next rate decision on December 9.
- Earnings growth is currently tracking at a rate of 30%, and if it holds, this will be the third consecutive quarter of earnings growth above 25%.
- Hyperscaler earnings suggested that demand for cloud and AI infrastructure is still substantial, but the pace of investment may run into more constraints given midterm election results, which could delay return on investment and productivity gains and slow economic growth.
Overview
U.S. large-cap stocks, as measured by the S&P 500 Index, declined 0.9% in October, while the small-cap Russell 2000 Index rose 0.6%. Both indices remain firmly positive year to date. The S&P 500 is up 12%, and the Russell 2000 is up 14% through the first ten months of 2026. Beneath the surface, there was massive rotation between style returns. The Russell 1000 Value, a proxy for large-cap value stocks, outperformed the Russell 1000 Growth by 11% in October, the third-largest monthly gap in value’s favor since 2000 (July’s 9% outperformance ranks fifth). Year to date, value leads growth by 25%. If that holds through year-end, it would be the second-largest annual outperformance for value since 2000, when value outperformed growth by 29%.
U.S. intermediate-term bonds, proxied by the Bloomberg U.S. Aggregate Bond Index, increased 2.4% in October, bringing the year-to-date return to -0.5%. If the index finishes the year in negative territory, it will mark only the sixth calendar-year loss since 1980. The Bloomberg Municipal Bond Index rebounded 3.4% in October, its second-best month since 2000, just one month after posting its worst month since the inception of the index in 1993.
Inflation ran above expectations in September. Headline CPI rose to 3.7% year-over-year, above the 3.6% estimate. Core CPI, which excludes food and energy, also topped expectations, climbing to 2.6% from 2.4%.1 Third-quarter GDP grew at a 3.4% annualized rate, above the 3.2% estimate and above the second quarter’s rate of 2.2%.2
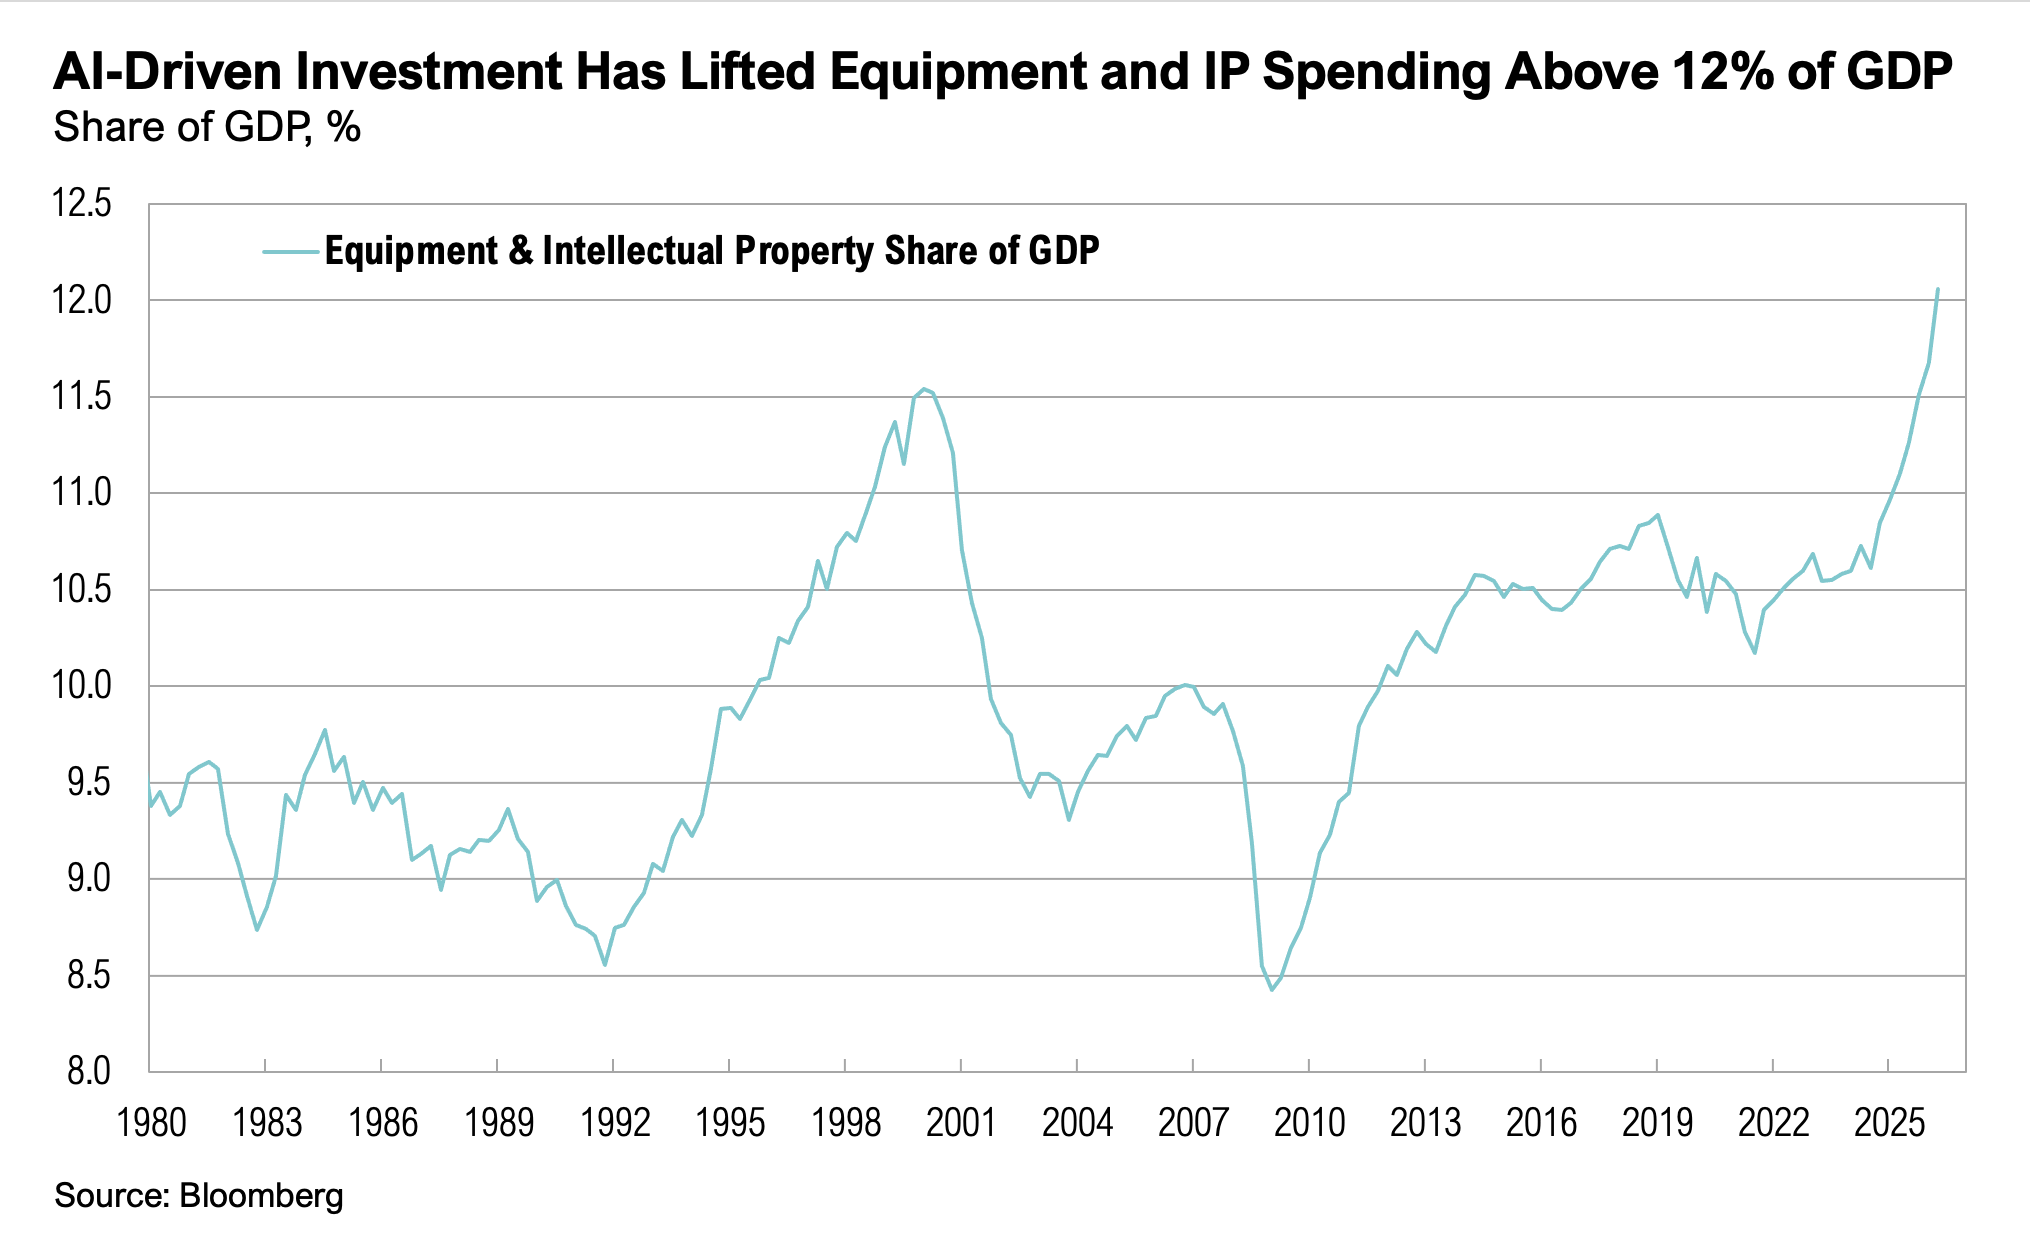
The Federal Reserve held its benchmark rate steady at a target range of 3.75%-4.00%, as expected, with two committee members dissenting in favor of a hike. The committee wanted to see additional economic data prior to its next rate decision on December 9. Fed Chair Kevin Warsh described a robust economy with accelerating growth, strong business investment, and a labor market near its best levels in years, leaving price stability as the clear focus of the Fed’s dual mandate. Business investment has been a key driver of economic growth. Spending on equipment and intellectual property, which includes software and AI infrastructure, has risen to over 12% of GDP, the highest share since at least 1980 and up from about 10.6% in 2024. As Warsh put it:
“So what exactly do we observe? Economic growth has strengthened. The GDP increase in the first half of this year was revised up from an earlier estimate of 1.8 percent up to 2.4 percent. And the third quarter appears to have brought an even more rapid advance, led by healthy consumer spending, likely running above 3 percent growth, and business investment, likely rising at about a double-digit pace.” 2,3
Warsh also announced that the Fed will begin reducing the number of rate-setting meetings starting next fall, dedicating one of its eight annual meetings in 2027 to monetary policy strategy, which will rise to two in 2028.3
As of this writing, 60% of S&P 500 companies have reported third-quarter results. Of them, 82% beat earnings expectations, and 70% topped revenue estimates. Earnings growth is currently tracking at a rate of 30%, and if that holds, it will mark the third consecutive quarter of earnings growth above 25% and the eighth consecutive quarter of double-digit growth for the index. Earnings growth for the “Magnificent 7” (Alphabet, Amazon, Apple, Meta, Microsoft, NVIDIA, and Tesla) has lagged the rest of the market. Their blended third-quarter earnings growth rate (which combines actual results for the companies that have reported and an estimate for NVIDIA) sits at 23% while the blended earnings growth rate for the other 493 S&P 500 companies is currently 33%. If this trend continues, this will be the first quarter since the fourth quarter of 2022 when the Magnificent 7 reported lower earnings growth than the rest of the index.4
Revenue growth has also been robust, tracking at a year-over-year increase of 13.4%. All eleven sectors are reporting higher revenues year over year, led by information technology, energy, and communication services. The S&P 500’s forward 12-month P/E ratio has declined to 18.7.4
Ohm’s Law
In electricity, Ohm’s law describes how electric current flows through a circuit. The amount of electricity that flows through a wire depends on how hard it is being pushed and how much resistance it meets along the way. Pushing harder allows more electricity to flow, while added resistance slows that flow, even when the force behind it stays the same. The lesson is that force alone does not determine the outcome; what gets through also depends on what stands in the way.
The AI infrastructure buildout resembles this relationship. Earnings season reached its busiest stretch in late October, with 36% of S&P 500 companies reporting in the final week of the month. Alphabet, Amazon, and Microsoft all reported that week, following Meta on October 21. These four hyperscalers have become bellwethers for the AI buildout. Third-quarter results showed continued progress in monetizing AI. Cloud revenue growth accelerated at Alphabet, Microsoft, and Amazon. Management teams reaffirmed their 2026 capex plans and signaled higher spending in 2027, continuing to push harder on the buildout. Per Amazon CEO Andy Jassy:
“…this is a once-in-a-lifetime opportunity… Would it be more convenient if this type of acceleration and opportunity happened over 25 years, and you could spread the CapEx over 25 years? Yeah, it might be more convenient, but that is not the world that we live in… We can fund this plan, and I think it will forever change the size of Amazon.”5
That push has, however, begun to meet resistance. In prior quarters, strong results from the hyperscalers’ core businesses (search, software, e-commerce, and advertising) generated more than enough cash to fund rising capex. In the third quarter, several of those core businesses softened, in some cases because of AI itself, while capex continued to climb and free cash flow declined. Investors reacted negatively to the weakness in the core businesses even as AI-related revenue accelerated. At the same time, hyperscalers have shown little desire to change course and have committed to record spending through 2026 and even higher spending in 2027.
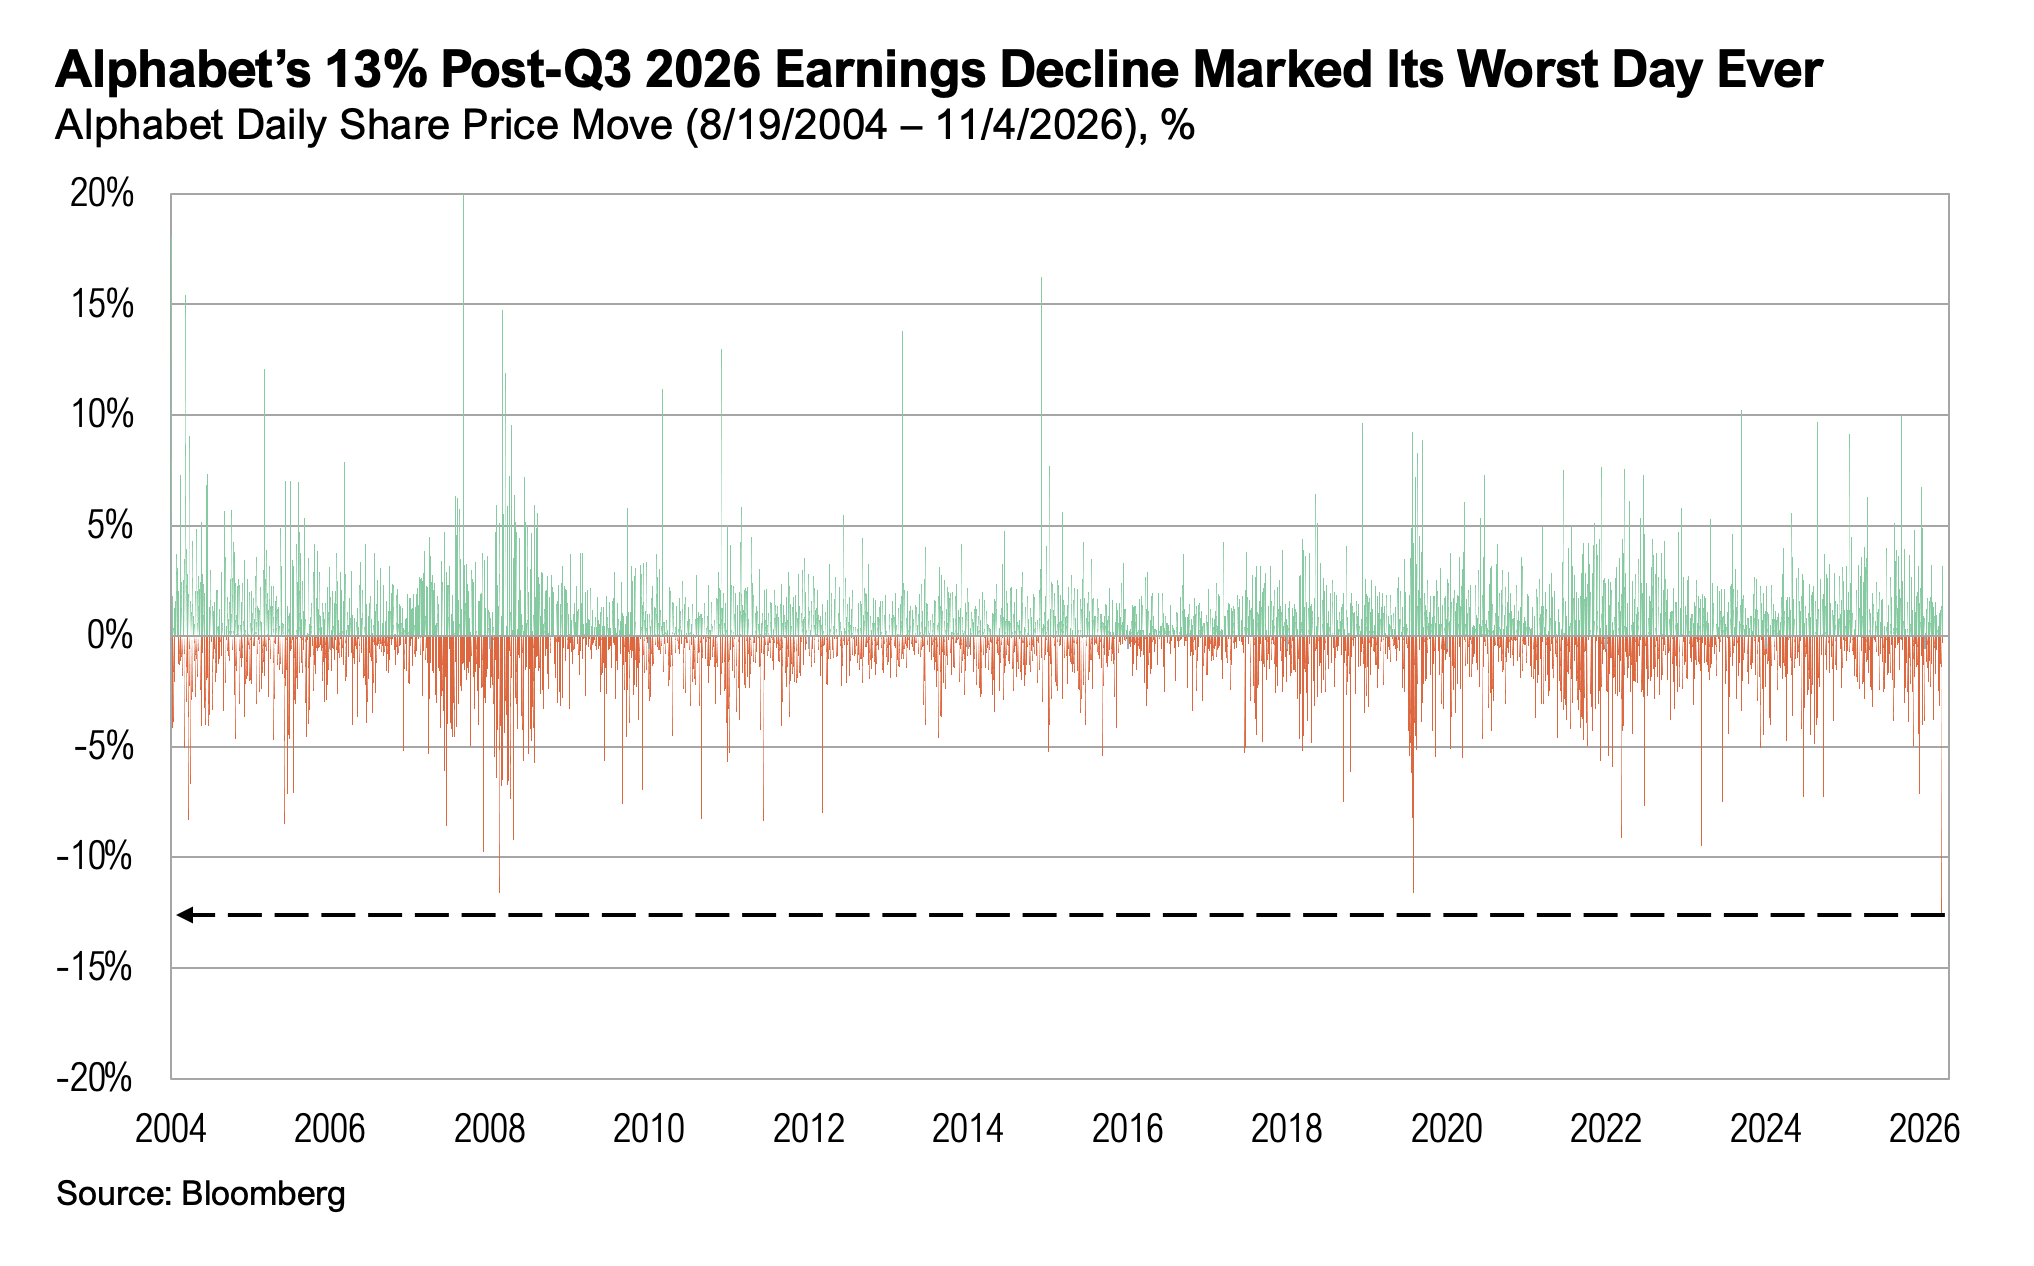
On October 28, Alphabet reported that Google Cloud more than doubled its revenue, while Search, the company’s largest business, grew 12% but fell short of estimates. The stock fell 13% the following day, its worst single-day decline on record. Management attributed part of the Search shortfall to AI Mode, Google’s AI-generated search experience, where ads have so far earned less than on traditional search pages. Per Chief Business Officer Philipp Schindler:
“…it’s worth noting that the strong growth in AI Mode queries had an impact because of the lower monetization we were seeing in AI Mode. To be clear, we feel very good about our trajectory here. Our ad experiments have shown promising results, and we’re now scaling ads within both AI Overviews and AI Mode to more users and more queries.”6
Microsoft and Amazon followed a similar pattern. Azure, Microsoft’s cloud computing platform, grew 48%, ahead of the company’s own guidance. Amazon Web Services grew 39%, its fastest pace in about five years, and management projected growth above 40% for both 2027 and 2028. Outside of cloud computing, Microsoft’s revenue tied to Windows PCs fell 22% partially because rising memory costs, driven by chipmakers directing supply toward AI data centers, have pushed up the price of new computers.5,7
Meta, which reported on October 21, was the exception to this trend. Its core advertising business remained strong, and its revenues beat expectations. Even so, the stock declined as free cash flow turned negative on rising AI spending. Management raised the low end of its 2026 capex range, and CEO Mark Zuckerberg explained:
“Personal superintelligence as the North Star for the work we’re doing here.”8
Beyond earnings, the AI buildout also met resistance outside of markets. Rising electricity bills and concerns about jobs emerged as campaign themes for both parties heading into the midterm elections. Residential electricity prices have risen more than 10% nationwide since late 2024, outpacing the rise in prices for other goods and services.9 In a June Reuters/Ipsos survey, 77% of respondents said they worry AI will make electricity more expensive, and only 14% said they would be okay with a data center being built near them.10
Those concerns were reflected in the midterm results. Democrats won control of both the House and Senate, flipping at least seven Republican-held Senate seats and reclaiming the House. Data centers were also on the ballot directly as voters in at least 38 jurisdictions across the country passed bans or restrictions on data centers, and in an NBC News exit poll, 56% of voters said AI and data centers were a crucial or major factor in their vote for Congress.11,12 Voters also elected gubernatorial and Senate candidates pledging tougher regulation of the projects, including new governors in Texas and Ohio, who campaigned on pausing data center development until new protections are in place.13 It remains unclear whether the results will affect projects that are already underway, but new local restrictions and tighter oversight could add further resistance to the pace of new data center development.
The stakes are significant because even though demand has not been the main constraint on the AI infrastructure buildout, the pace at which new capacity comes online has been. Any delay in approvals, construction, or power connections pushes back revenue. Speaking at NVIDIA’s GTC Berlin conference, CEO Jensen Huang put a number on the cost:
“Each gigawatt data center is $50 billion. The revenue generation you expect is tens of billion dollars per year. And so we just said it’s $40 billion per year of revenue generation that comes out of that infrastructure. $40 billion, if delayed by just three months, that’s $10 billion worth of revenues. $10 billion worth of revenues will make anybody anxious.”14
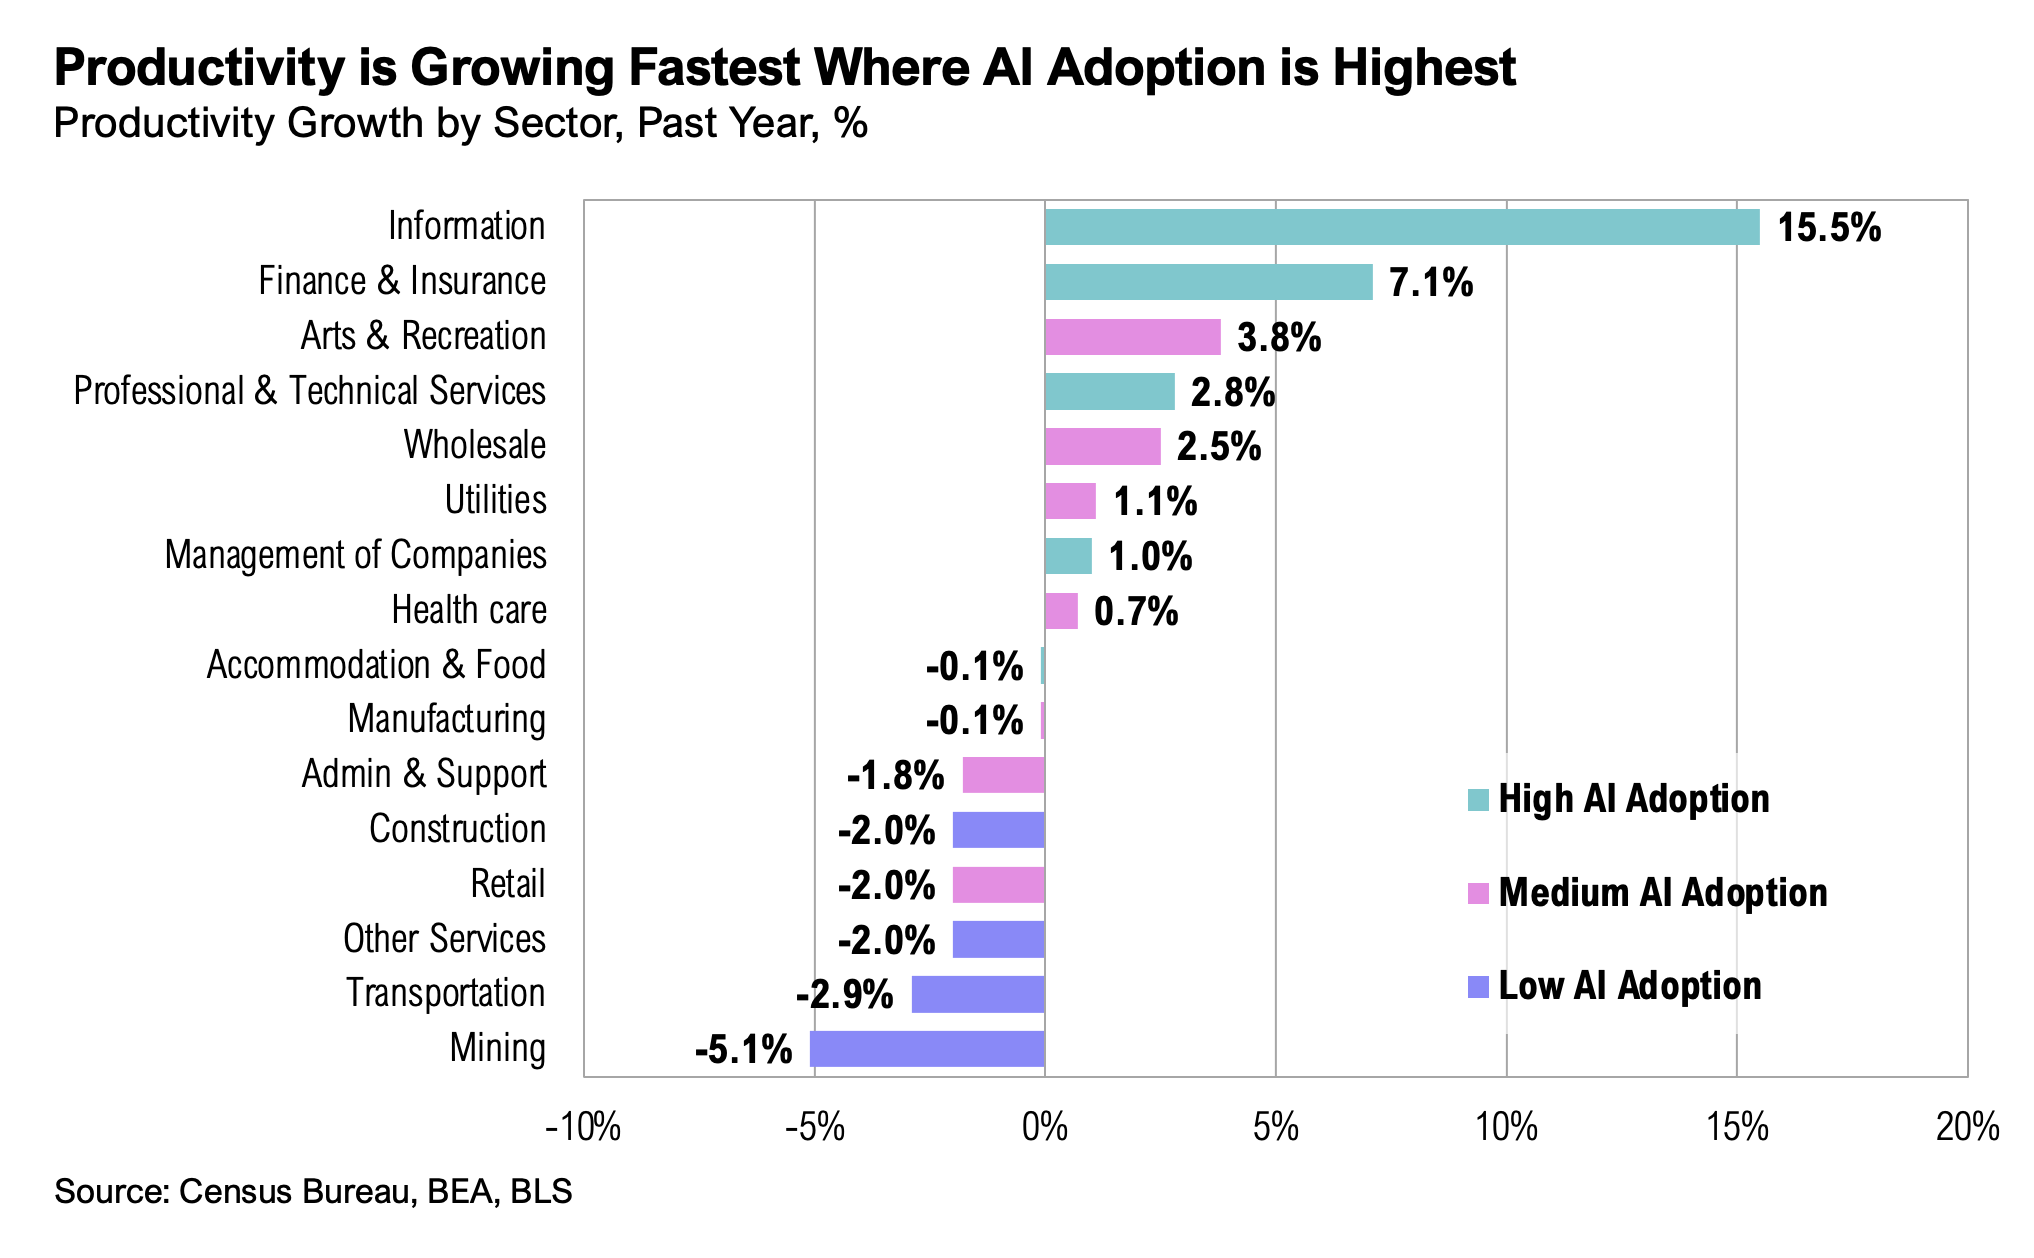
Early evidence suggests that AI is beginning to lift productivity. The high-adoption sectors, classified as those where at least 30% of firms report using AI in the Census Bureau’s Business Trends and Outlook Survey, grew productivity (output growth minus growth in hours worked) by 6.2% over the past year, nearly double their 3.3% average from 2019 to 2023. Medium-adoption sectors grew just 0.2%, and low-adoption sectors declined 1.9%.15,16,17 Higher productivity means producing more with fewer hours of work, and in a June Reuters/Ipsos poll, 53% of Americans said they worry that they or someone in their household will lose their job because of AI.18
These developments highlight the balance at the center of the AI buildout. The hyperscalers continue to push harder, their AI businesses are growing quickly, and demand for AI computing remains strong. At the same time, resistance has become more visible, from softer core businesses, from investors, and now from voters. As Ohm’s law suggests, what gets through, the pace at which new capacity comes online, will depend on both.
Markets
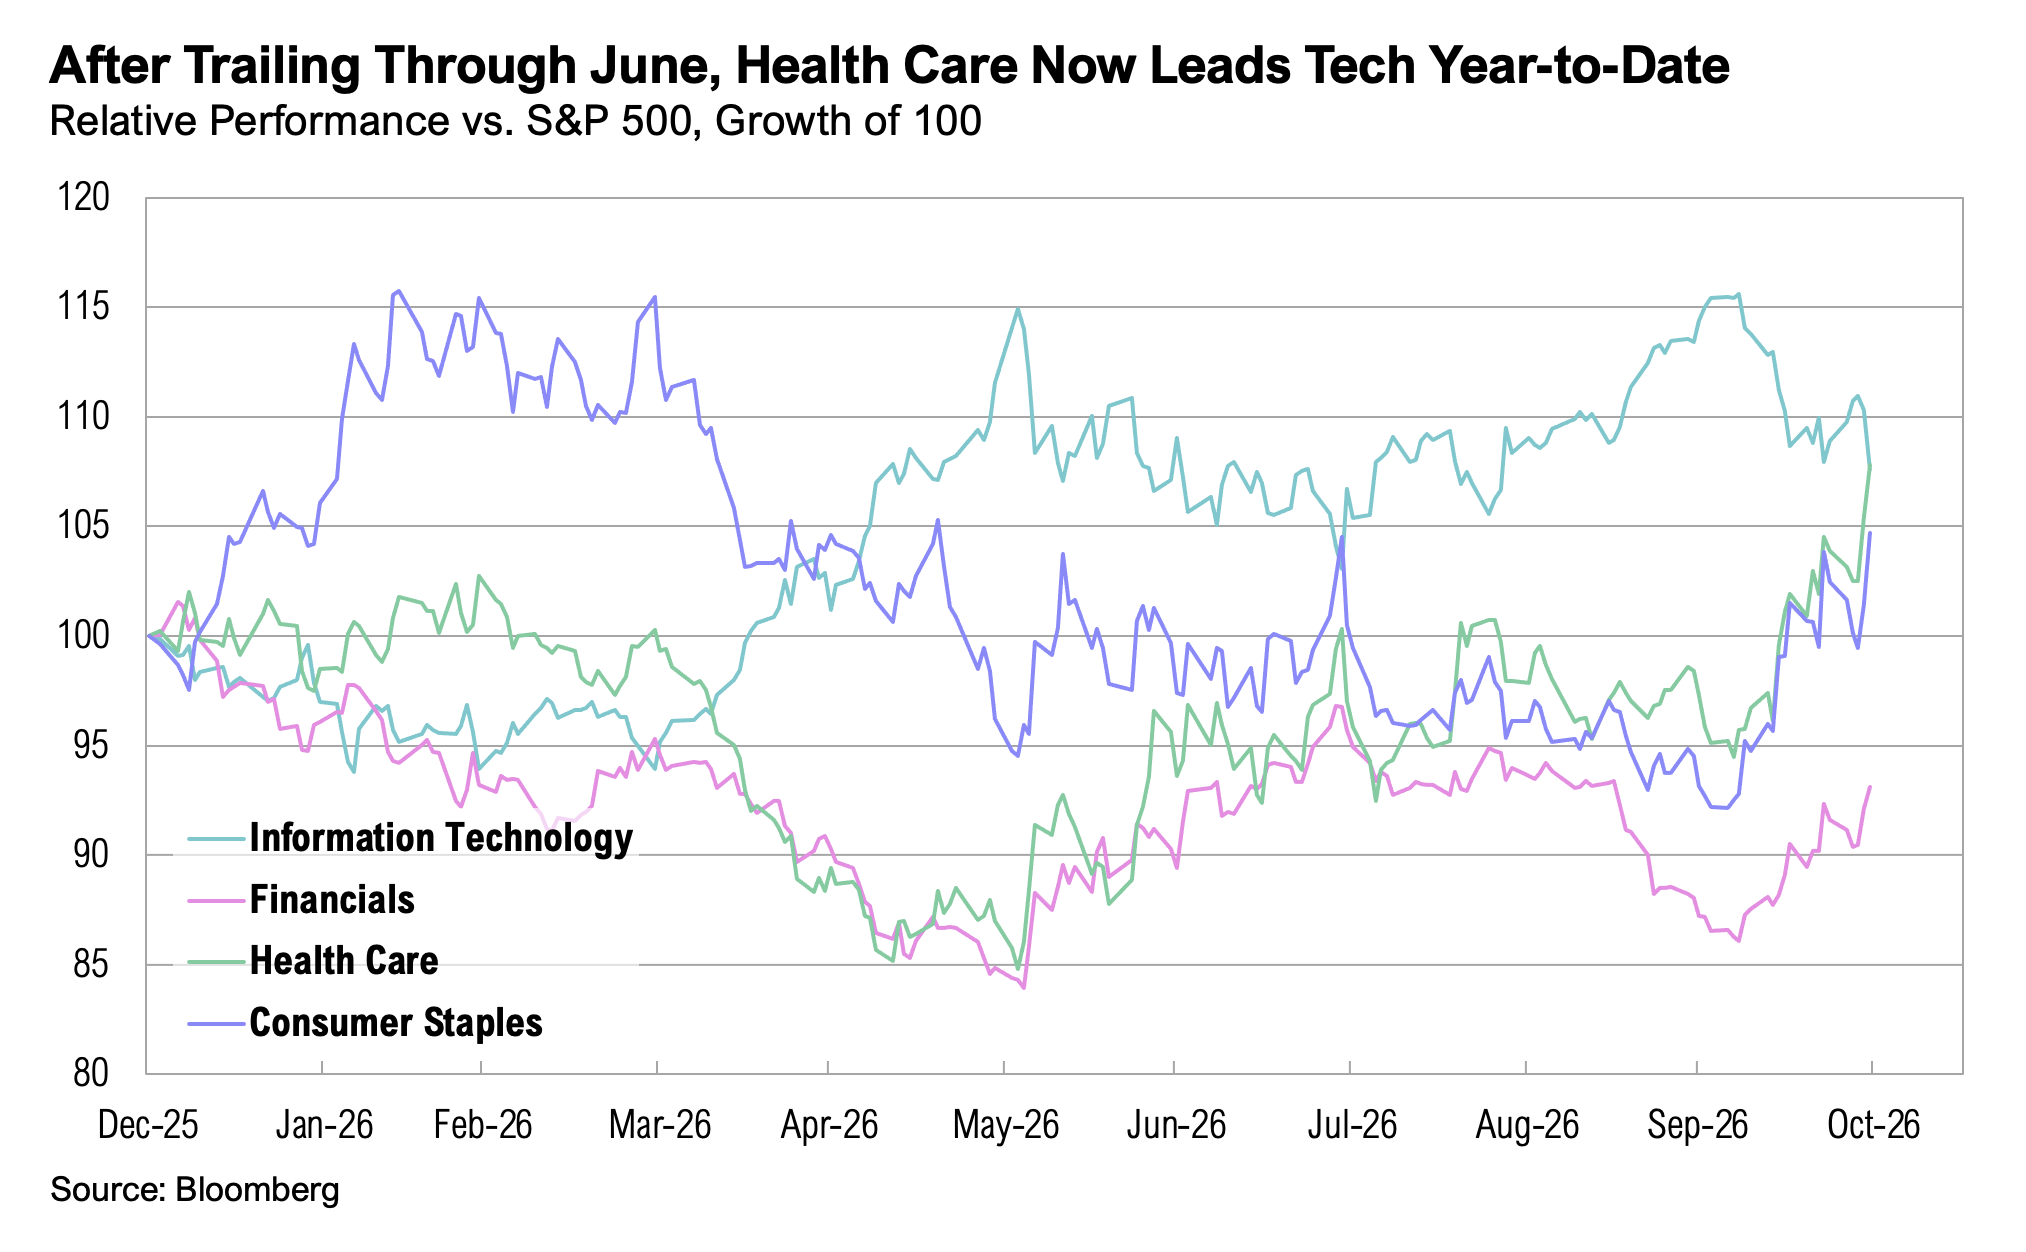
Ohm’s law has a second lesson. When electricity has more than one path available, more of it flows toward the path that offers the least resistance. Investors behaved much the same way in October. The S&P 500’s 0.9% decline masked an enormous rotation between sectors. Information technology fell 6.8%, and communication services fell 15.2%. These were the only two sectors to decline, but together they make up nearly half of the index. Every other sector rose. Energy led with a 14.0% gain, followed by consumer staples at 11.4%, utilities at 10.1%, and health care at 9.8%. The top three performing sectors represent only about 10% of the S&P 500, so their gains did little to lift the index.
International stocks also declined in October. Emerging markets, as measured by the MSCI Emerging Markets Index, fell 8.0%, driven by South Korea (-15.6%) and Brazil (-12.0%). In South Korea, shares of memory chipmakers SK Hynix and Samsung Electronics fell 20.2% and 16.2%, respectively, as the selloff in AI-related stocks spread to Asia. In Brazil, President Luiz Inácio Lula da Silva defeated Flávio Bolsonaro in an October 25 runoff, and the Ibovespa fell 14% on the first trading day after the election, its sharpest one-day decline since the onset of the COVID-19 pandemic. Developed international large-cap stocks, represented by the MSCI EAFE Index, declined 0.7%.
Looking Forward
The twelve months after midterm elections are typically among the strongest periods for market performance within the U.S. political cycle, and equity valuations today are more reasonable than at the start of the year. In every midterm cycle since 1946, the S&P 500 has been higher one year after election day than on election day itself, and since 1950, the average one-year return following a midterm has been 15.4%. The S&P 500’s forward P/E has fallen from 22.0x to 18.7x and is now below its 10-year average of 19.1x. Some of that reflects higher bond yields, which raise the bar for stocks, but it is a healthier valuation backdrop all else equal. Technology also looks increasingly attractive relative to defensive sectors following the recent rotation.
Although inflation remains above the Fed’s target, we are not too worried about it accelerating much from here, even if it remains elevated through the first quarter of next year. After that, year-over-year comparisons begin to lap this year’s energy price shock. The housing market is softening, and we think the labor market could soften in 2027 as companies move from piloting AI to putting it to more productive use. For many firms, 2026 has been the year of pilot AI programs, and 2027 may produce more tangible results.
However, given the range of possible outcomes, we continue to favor diversification—across the beneficiaries of the AI buildout and beyond it. Just like with second-quarter results, recent earnings have strengthened the case that demand for cloud and AI infrastructure is substantial, but the pace of investment may face additional constraints following the midterm elections. We remain very constructive on the long-term prospects for AI adoption and advancement, although technological progress will not necessarily translate into attractive investment returns for every company involved in the buildout. Delays to new capacity could also push back productivity gains and weigh on economic growth.
Higher taxes are a concern for the coming years, not for now. Any tax increase before 2029 would need the President’s signature, and most individual tax cuts were made permanent last year. However, the midterm result makes a Democratic sweep in 2028 more plausible, and with deficits as large as they are, the fiscal debate could then turn toward raising revenue. It is not something to position for today, but it is a risk we will watch as 2028 approaches.
Performance Disclosures
All market pricing and performance data from Bloomberg, unless otherwise cited. Asset class and sector performance are gross of fees unless otherwise indicated.
Citations
- Bureau of Labor Statistics: CPI Home : U.S. Bureau of Labor Statistics
- Bureau of Economic Analysis: https://www.bea.gov/data/gdp/gross-domestic-product
- Federal Reserve: The Fed – October 27-28, 2026 FOMC Meeting
- FactSet: EarningsInsight_103026.pdf
- Amazon Q3 Earnings Call: Amazon.com, Inc. – Q3 2026 Amazon.com, Inc. Earnings Conference Call
- Alphabet Q3 Earnings Call: Alphabet Investor Relations – 2026 Q3 Earnings Call
- Microsoft Q3 Earnings Call: FY27 Q1 – Press Releases – Investor Relations – Microsoft
- Meta Q3 Earnings Call: Meta – Meta Reports Third Quarter 2026 Results
- U.S. News: Power Bills and Data Centers Cast Rare Spotlight on Utilities in US Midterms
- Reuters: Americans wary of AI-driven data center boom, Reuters/Ipsos poll shows | Reuters
- Washington Post: A nationwide backlash against data centers erupts at the polls – The Washington Post
- NBC News: National Exit Polls: Election 2026 Results
- CNBC: SpaceX, Tesla stocks fall over 4% on Democrats big win
- NVDA GTC Berlin 2026: Transcript of NVIDIA GTC Berlin 2026: Jensen Huang Full Keynote – The Singju Post
- Bureau of Economic Analysis: GDP by Industry | U.S. Bureau of Economic Analysis (BEA)
- Bureau of Labor Statistics: Current Employment Statistics – CES (National) : U.S. Bureau of Labor Statistics
- Census Bureau: BTOS – Data
- Reuters: Half of Americans fear AI could put someone in their household out of work, Reuters/Ipsos poll finds | Reuters
Index Definitions
The S&P 500 Index is widely regarded as the best single gauge of the United States equity market. It includes 500 leading companies in leading industries of the U.S. economy. The S&P 500 focuses on the large cap segment of the market and covers approximately 75% of U.S. equities.
The Bloomberg Barclays U.S. Aggregate Index represents securities that are SEC-registered, taxable, and dollar denominated. The index covers the U.S. investment grade fixed rate bond market, with index components for government and corporate securities, mortgage pass-through securities, and asset-backed securities. Duration is roughly 5 years.
The Bloomberg U.S. Municipal Index covers the USD-denominated long-term tax exempt bond market. The index has four main sectors: state and local general obligation bonds, revenue bonds, insured bonds and prerefunded bonds.
The Bloomberg U.S. Corporate High Yield Bond Index measures the USD-denominated, high yield, fixed-rate corporate bond market. Securities are classified as high yield if the middle rating of Moody’s, Fitch and S&P is Ba1/BB+/BB+ or below. Bonds from issuers with an emerging markets country of risk, based on the indices’ EM country definition, are excluded.
The Bloomberg US Aggregate Bond Index (known as “the Agg”) is a flagship, market capitalization-weighted benchmark for the U.S. investment-grade, taxable fixed-income market.
The Russell 1000® Index measures the performance of the large cap segment of the US equity market. The index includes approximately 1,000 of the largest US companies based on a combination of their market cap and current index membership. The Russell 1000 Index is a subset of the Russell 3000® Index, which was designed to represent approximately 98% of the investable US equity market.
The Russell 2000® Index measures the performance of the small-cap segment of the US equity universe. It includes approximately 2000 of the smallest US equity securities in the Russell 3000© Index based on a combination of market capitalization and current index membership. The Russell 2000© Index represents approximately 10% of the total market capitalization of the Russell 3000© Index.
The U.S. Dollar Index is used to measure the value of the dollar against a basket of six foreign currencies: the euro, Swiss franc, Japanese yen, Canadian dollar, British pound, and Swedish krona.
The MSCI EAFE Index is an equity index which captures large and mid cap representation across Developed Markets countries around the world, excluding the US and Canada. The index covers approximately 85% of the free float-adjusted market capitalization in each country.
Disclaimers
*Source: MSCI.MSCI makes no express or implied warranties or representations and shall have no liability whatsoever with respect to any MSCI data contained herein. The MSCI data may not be further redistributed or used as a basis for other indexes or any securities or financial products. This report is not approved, endorsed, reviewed or produced by MSCI. None of the MSCI data is intended to constitute investment advice or a recommendation to make (or refrain from making) any kind of investment decision and may not be relied on as such.
The opinions and analyses expressed in this newsletter are based on Curi Capital, LLC’s (“Curi Capital”) research and professional experience are expressed as of the date of our mailing of this newsletter. Certain information expressed represents an assessment at a specific point in time and is not intended to be a forecast or guarantee of future results, nor is it intended to speak to any future time periods. Curi Capital makes no warranty or representation, express or implied, nor does Curi Capital accept any liability, with respect to the information and data set forth herein, and Curi Capital specifically disclaims any duty to update any of the information and data contained in this newsletter. The information and data in this newsletter does not constitute legal, tax, accounting, investment or other professional advice. Returns are presented net of fees. An investment cannot be made directly in an index. The index data assumes reinvestment of all income and does not bear fees, taxes, or transaction costs. The investment strategy and types of securities held by the comparison index may be substantially different from the investment strategy and types of securities held by your account.