
Key Takeaways
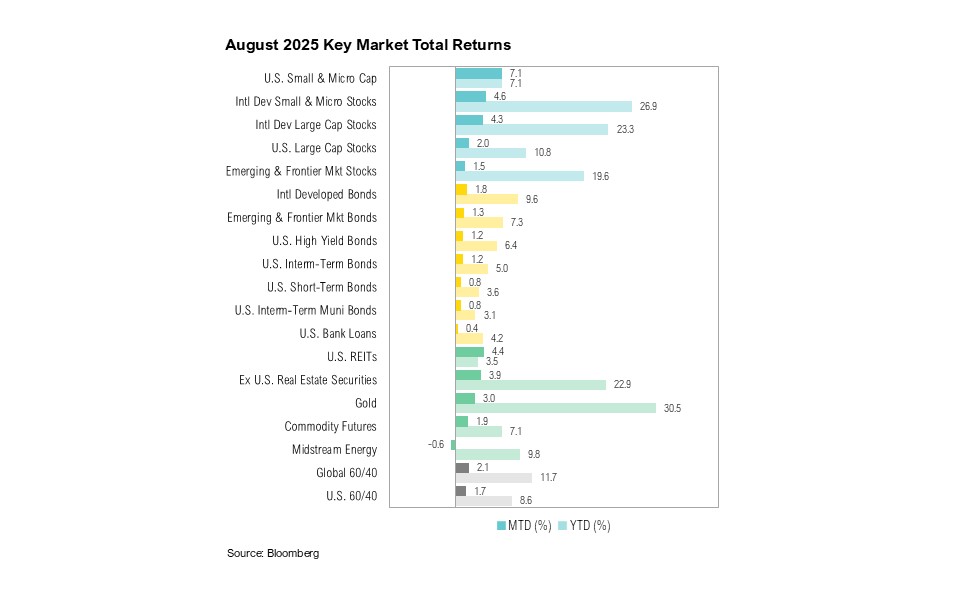
- U.S. large-cap stocks, as measured by the S&P 500, gained 2.0% in August while small-cap stocks rose 7.1%, marking the best August for small-caps in 25 years. U.S. intermediate-term bonds increased by 1.2%.
- Jerome Powell delivered his final keynote as Fed Chair at the annual Jackson Hole Economic Symposium, with markets initially interpreting his remarks as dovish, though hawkish elements tempered rate cut expectations.
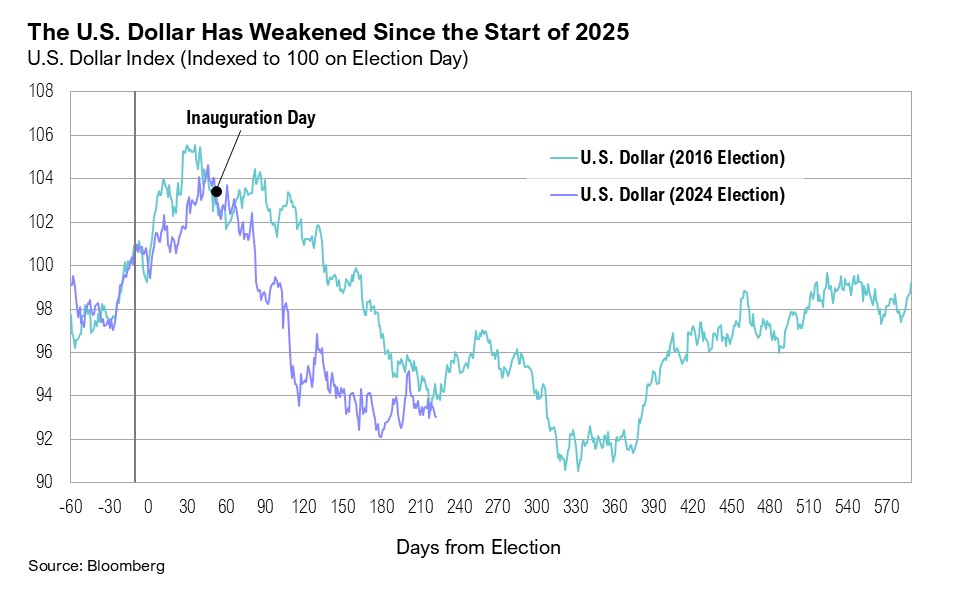
- At Jackson Hole, the Fed abandoned its average inflation-targeting framework, signaling a return to more traditional goals. The U.S. dollar dropped 1.3% on the news.
- Bond yields—the linchpin of continued expansion—remain subdued, reflecting a “curious balance” between a softening labor and housing market on one side and persistent inflation on the other.
Overview
U.S. large-cap stocks, measured by the S&P 500 Index, rose 2.0% in August. U.S. small-cap stocks, as proxied by the Russell 2000 Index, ended the month up a noteworthy 7.1%. This marked the Russell 2000’s strongest monthly return since November 2024 and its best August since 2000. U.S. intermediate-term bonds, as proxied by the Bloomberg U.S. Aggregate Bond Index, gained 1.2% in August. Economic data in the U.S. struck a curious balance between softening in some areas, like the labor market, but continued strength in other areas.

August started with the release of the July jobs report, which showed non-farm payrolls adding only 73,000 new jobs over the month and missing estimates by 32,000. The report also revised down May and June payrolls by a combined 258,000 jobs—the largest downward revision outside of April and May 2020, when pandemic-related adjustments were made. 1 Private payrolls also undershot expectations, with ADP reporting only 54,000 jobs added in August, while corporate layoffs surged 39% year-over-year to nearly 86,000—the highest August tally since 2020. 2,3 The August jobs report, released in early September, showed just 22,000 jobs added over the month. It also included further downward revisions to June, which now shows payrolls falling by 13,000—the first monthly decline in employment since 2020. 4 These figures underscore mounting evidence that the labor market is losing momentum.
Inflation data released during the month showed headline CPI rising 2.7% year-over-year in July (the fastest pace since January) while core CPI increased 3.1%. 5 Each month, the Bureau of Labor Statistics gathers roughly 90,000 price quotes across 200 categories, but with more than 30% of CPI inputs now estimated (up from the usual 10%) nearly a third of today’s index is built on approximations rather than directly observed prices. 6 Goods prices remained subdued, easing concerns over tariff-related pass-through effects. For example, major appliances, which rose 1.9% month-over-month in June and are more than 60% imported, fell 2.4% in July. 7 Smartphone prices, which were previously highlighted as a tariff-sensitive category, remained unchanged for the second consecutive month. 7 Notably, the U.S. share of smartphone shipments coming out of China dropped from 61% in the second quarter of 2024 to just 25% in the second quarter of 2025. 8
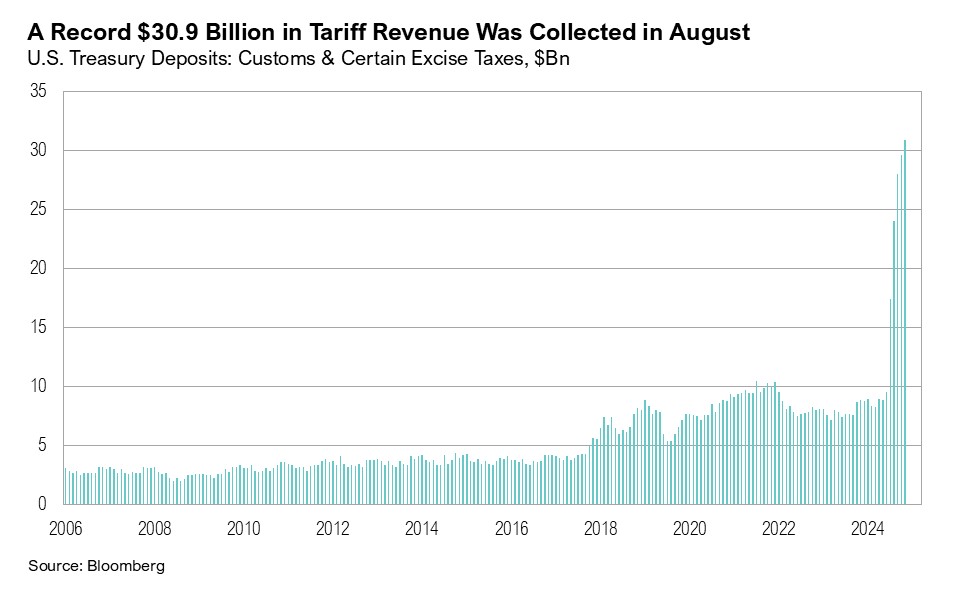
On the trade front, the President signed an executive order extending the tariff truce with China by 90 days, through November 10. 9 The extension delayed a planned escalation that could have increased U.S. duties on Chinese goods from 40% to as high as 145%. Separately, on August 27, tariffs of 50% on goods imported from India—reflecting a 25% penalty linked to India’s continued purchases of Russian oil—took effect. 10 Negotiations between the U.S. and India continued throughout the month without a formal agreement. Overall, U.S. tariff revenues set another record in August, with $31 billion collected. 11
Consumer confidence remained subdued. The University of Michigan’s index registered 58.2 in August, well below its 30-year average of 85.3, while the Conference Board’s index stood at 97.4, also below its historical average of 98.9. 12,13 According to the Conference Board, rising concerns about jobs and income offset optimism about current and future business conditions, alongside higher prices stemming from tariffs. 13 Notably, the University of Michigan saw the number of survey respondents (512, to be exact) drop to the lowest level in nearly a decade in July. 14
The second estimate of second-quarter GDP showed the U.S. economy expanding at an annualized 3.3% quarter-over-quarter, a 0.3% upward revision from the initial estimate. 15 The revision reflected stronger consumer spending and business investment, partly offset by higher imports and reduced government spending. Looking ahead, the Federal Reserve Bank of Atlanta’s GDPNow model estimate for real U.S. GDP growth for the third quarter rose from 2.2% to 3.5% at the end of August. 16 The increase was driven by improved growth estimates for consumer spending and private domestic investment. 16
A Curious Balance
The Federal Reserve remained in focus in August with the annual Jackson Hole Economic Symposium. Organized by the Federal Reserve Bank of Kansas City since 1978, the conference has grown into one of the most influential gatherings for global central bankers, finance ministers, economists, and financial market participants. The keynote speech, which is typically delivered by the Fed Chair, is closely scrutinized by markets, as even subtle shifts in language can signal changes in the monetary policy outlook.
On August 22, Jerome Powell gave his last keynote speech as Federal Reserve Chair. Markets initially perceived Powell’s speech to be dovish (a dovish stance prefers easing monetary policy and lower interest rates, while a hawkish stance leans towards tighter monetary policy and higher interest rates), but a hawkish tone tampered interest rate cut expectations. Equity markets rallied (the S&P 500 ended the day up 1.5% and the Russell 2000 jumped 3.8%) while the 10-year Treasury yield dropped from 4.33% to 4.26%.
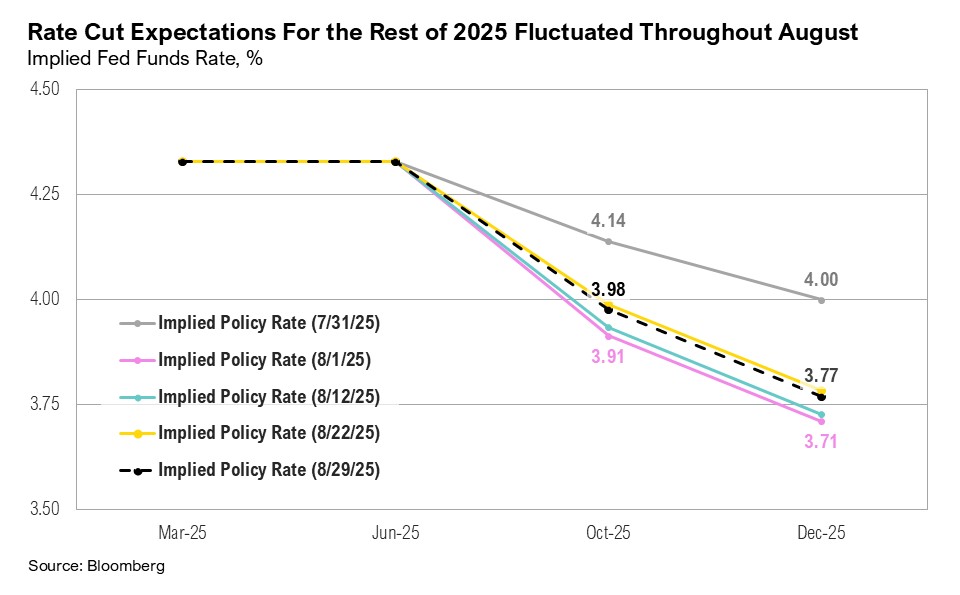
As Powell spoke, markets priced in a nearly 100% probability of a 0.25% rate cut at the September FOMC meeting, with some probability of a 0.5% cut beginning to emerge. By the end of the day, however, as investors reassessed his remarks, the probability of a September cut had slipped back to around 80%, the same level where it had started the week. 17 As of the end of August, markets expected the equivalent of two 0.25% interest rate cuts before the end of 2025—one in September, and one in December. 17
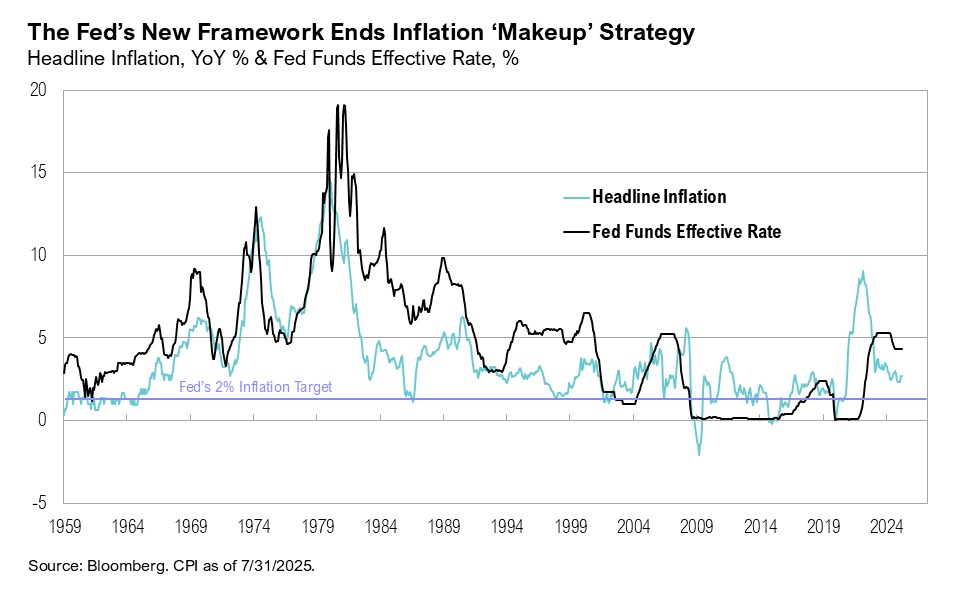
Historically, Jackson Hole has often been the platform for important Fed framework announcements. The monetary policy framework functions as the Fed’s “rulebook,” covering inflation goals, employment goals, policy tools (interest rates and quantitative easing, amongst other measures), and longer-term strategy changes. Before 2020, the Fed treated its 2% inflation target as more of an upper bound. As a result, inflation frequently ran below target—the average year-over-year annual inflation rate from January 2010 to January 2020 was 1.7%. At the 2020 symposium, the Fed introduced a more flexible approach: the 2% target became an average to hit over time, thereby allowing inflation to temporarily overshoot 2% to compensate for earlier periods of undershooting. 18 The 2020 framework changes also reduced the emphasis on preemptively tightening policy in response to low unemployment, signaling greater tolerance for both higher inflation and lower interest rates. 18
Five years later at Jackson Hole 2025, the Fed reset its framework. It dropped language referencing a “low-rate environment” and abandoned the “makeup” strategy that had permitted inflation to exceed 2% to offset past shortfalls. 19 Even though headline inflation averaged 4.4% between August 2020 and August 2025—more than double the official inflation target—the Fed appeared to communicate comfort with that overshoot, and no desire to correct it. Further, the Fed returned to a version of flexible inflation targeting, emphasizing balance across its dual mandate of price stability and maximum employment. 19 According to Powell:
“As it turned out, the idea of an intentional, moderate inflation overshoot had proved irrelevant. There was nothing intentional or moderate about the inflation that arrived a few months after we announced our 2020 changes to the consensus statement…” 20
Importantly, the term “shortfalls” in employment was replaced with “deviations”. On the current balance between inflation and the labor market, Powell said:
“In the near term, risks to inflation are tilted to the upside, and risks to employment to the downside—a challenging situation… Overall, while the labor market appears to be in balance, it is a curious kind of balance that results from a marked slowing in both supply of and demand for workers. This unusual situation suggests that downside risks to employment are rising. And if those risks materialize, they can do so quickly in the form of sharply higher layoffs and rising unemployment.” 19
Powell opening up the possibility of a September interest rate cut supported market sentiment, contributing to a post-Jackson Hole rally in equity markets, particularly for small-cap stocks. The Russell 2000 gained 4% between August 22 and August 29, while the S&P 500 increased by 1.4% over the same period, reaching a new all-time high on August 28. International developed market stocks (as proxied by the MSCI EAFE Index) initially gained 1.6% on Powell’s Jackson Hole speech but declined by 0.4% between August 22 and August 29. The 10-year Treasury yield declined post-Jackson Hole, easing from 4.33% to 4.26% on August 22, and easing further to end the month at 4.23%. While elements of Powell’s speech at Jackson hole emphasized the significance of the 2% inflation target, markets appear to have interpreted his balance as a dovish tilt.
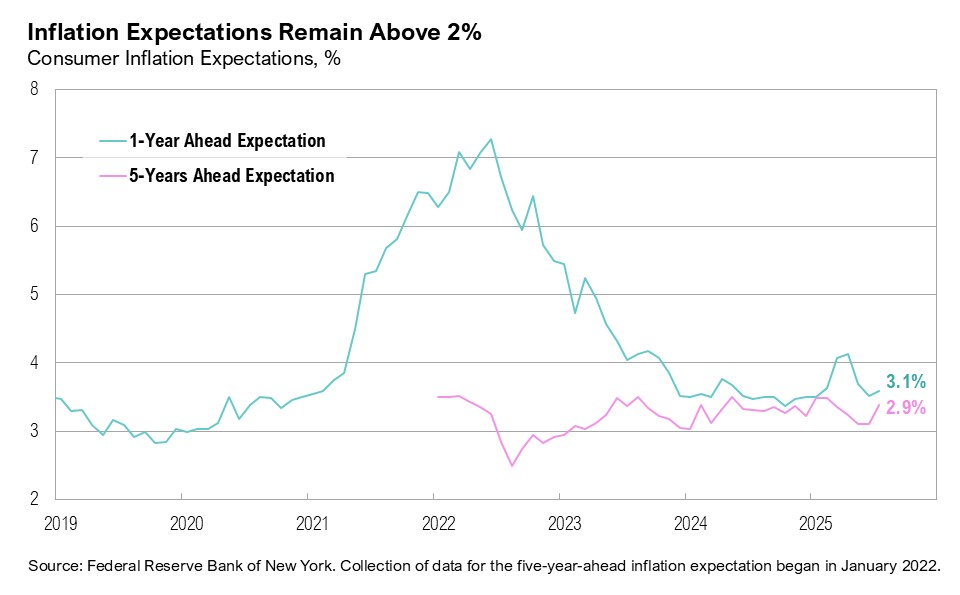
Given the framework adjustments and mixed comments from Powell, markets will be watching consumer inflation expectations closely. Prior to Jackson Hole, consumer surveys suggested expectations were well above target: the University of Michigan one-year inflation expectation was 4.8%, with long-term expectations at 3.5%, while the New York Fed survey showed one-year expectations at 3.1% and five-year expectations at 2.9%. 12,21
Helped by increased rate cut expectations, the U.S. dollar has weakened against other major currencies, with the U.S. Dollar Index ending August down 2.3% (and is down by 10.4% year-to-date), including a 1.3% drop on the day of Powell’s speech—a move that illustrated the net result of the “curious balance”. A weaker dollar could have mixed effects globally, potentially boosting exports, but also increasing the cost of imports.
Markets
U.S. large-cap stocks ended August up 2.0%, underperforming foreign peers by 2.3%, as international developed market stocks ended up 4.3%. U.S. small-cap stocks ended the month up a noteworthy 7.1% while international developed market small cap stocks ended the month up 4.6%. Since the April 8th S&P 500 market low, U.S. small-cap stocks have gained 34%, outperforming U.S. large-caps, which have gained 30%.
Gold, which remains a top performer year-to-date (gaining 31% since January), ended the month up 3.0%, and at a new record high of $3,445 per ounce. West Texas Intermediate (WTI) crude oil prices traded between $67 per barrel and $62 per barrel throughout the month, while national average gas prices eased to the lowest price for this time of year in five years. 22
Looking Forward
As policymakers search for what Powell called a ‘curious balance’ between inflation and employment, the outcome is less curious in the economy and markets: the last two Fed framework adjustments have tolerated inflation running above target for years while supporting nominal growth and asset prices.
Bond yields remain pivotal—so long as they stay contained, they enable this policy stance—and they themselves are in a curious balance, caught between a softening labor and housing market on one side and continued elevated inflation on the other. AI is beginning to reshape the labor market, but it may also deliver productivity gains that support corporate margins. Inflation continues to flow through via tariffs and targeted goods, though offsets include low energy prices and cooling housing costs. With most risky assets substantially above their April lows and valuations elevated, we believe investors should maintain a healthy level of risk—balanced, not excessive, and tilted toward areas with strong fundamentals and policy tailwinds.
We expect the volatility in markets to continue and remain cautious with risk assets as the current cycle plays out. A weaker labor market and further threat of tariffs have meaningfully increased the likelihood of multiple rate cuts in 2025, which could provide a modest tailwind for risk assets in the near term. The Federal Reserve will continue to play a key role and their response to economic conditions will be in focus leading up to next week’s FOMC meeting.
No one can predict the future, and with heightened levels of uncertainty, this is not a time to make big bets or try to time the market. We believe that portfolio-level decisions on specific companies and assets are likely to have more clarity than macro views in this environment. We remain biased towards high-quality companies with strong management teams that will be able to navigate the current environment. We positioned our core bond portfolios with reduced interest rate and credit risk exposures. As always, we believe clients are best served reminding themselves of the timeless principles of patience and diversification. The key to successful investing is often remaining committed to long-term investment plans.
Citations
- MacroMicro: https://en.macromicro.me/charts/99068/nonfarm-payrolls-monthlychange-2months-revisions
- ADP Employment Report: https://adpemploymentreport.com/
- Challenger, Gray & Christmas: https://www.challengergray.com/blog/pharma-and-finance-lead-as-august-2025-job-cuts-rise-39-to-85979/
- Bureau of Labor Statistics: https://www.bls.gov/news.release/empsit.nr0.htm
- Bureau of Labor Statistics: https://www.bls.gov/news.release/cpi.nr0.htm
- Apollo Academy: https://www.apolloacademy.com/the-quality-of-the-cpi-data-continues-to-deteriorate/
- BLS: https://www.bls.gov/news.release/cpi.t02.htm
- Reuters: https://www.reuters.com/business/media-telecom/us-smartphone-market-sees-sluggish-growth-india-made-phones-surge-canalys-says-2025-07-28/
- New York Times: https://www.nytimes.com/2025/08/11/us/politics/us-china-trade-tariffs-deal.html
- BBC: https://www.bbc.com/news/articles/c5ykznn158qo
- Bloomberg data series
- University of Michigan Survey of Consumers: https://www.sca.isr.umich.edu/
- Conference Board: https://www.conference-board.org/topics/consumer-confidence/
- Bloomberg data series
- Bureau of Economic Analysis: https://www.bea.gov/sites/default/files/2025-08/gdp2q25-2nd.pdf
- Federal Reserve Bank of Atlanta: https://www.atlantafed.org/cqer/research/gdpnow/archives
- CME: https://www.cmegroup.com/markets/interest-rates/cme-fedwatch-tool.html
- Federal Reserve: https://www.federalreserve.gov/newsevents/speech/powell20200827a.htm
- Federal Reserve: https://www.federalreserve.gov/newsevents/speech/powell20250822a.htm
- CNBC: https://www.cnbc.com/2025/08/22/powell-indicates-conditions-may-warrant-interest-rate-cuts-as-fed-proceeds-carefully.html
- Federal Reserve Bank of New York: https://www.newyorkfed.org/microeconomics/sce#/
- AAA: https://gasprices.aaa.com/gas-prices-go-down-but-how-low-will-they-go/
Index Definitions
The S&P 500 Index is widely regarded as the best single gauge of the United States equity market. It includes 500 leading companies in leading industries of the U.S. economy. The S&P 500 focuses on the large cap segment of the market and covers approximately 75% of U.S. equities.
The Bloomberg Barclays U.S. Aggregate Index represents securities that are SEC-registered, taxable, and dollar denominated. The index covers the U.S. investment grade fixed rate bond market, with index components for government and corporate securities, mortgage pass-through securities, and asset-backed securities. Duration is roughly 5 years.
The Bloomberg U.S. Corporate High Yield Bond Index measures the USD-denominated, high yield, fixed-rate corporate bond market. Securities are classified as high yield if the middle rating of Moody’s, Fitch and S&P is Ba1/BB+/BB+ or below. Bonds from issuers with an emerging markets country of risk, based on the indices’ EM country definition, are excluded.
The Russell 2000® Index measures the performance of the small-cap segment of the US equity universe. It includes approximately 2000 of the smallest US equity securities in the Russell 3000 Index based on a combination of market capitalization and current index membership. The Russell 2000 Index represents approximately 10% of the total market capitalization of the Russell 3000 Index. Because the Russell 2000 serves as a proxy for lower quality, small cap stocks, it provides an appropriate benchmark for RMB Special Situations.
The U.S. Dollar Index is used to measure the value of the dollar against a basket of six foreign currencies: the euro, Swiss franc, Japanese yen, Canadian dollar, British pound, and Swedish krona.
MSCI U.S. REIT Index is a free float-adjusted market capitalization weighted index that is comprised of equity Real Estate Investment Trusts (REITs). The index is based on the MSCI USA Investable Market Index (IMI), its parent index, which captures the large, mid and small cap segments of the USA market. With 150 constituents, it represents about 99% of the US REIT universe and securities are classified under the Equity REITs Industry (under the Real Estate Sector) according to the Global Industry Classification Standard (GICS®), have core real estate exposure (i.e., only selected Specialized REITs are eligible) and carry REIT tax status.
Disclaimers
Performance Disclosures
All market pricing and performance data from Bloomberg, unless otherwise cited. Asset class and sector performance are gross of fees unless otherwise indicated.
The opinions and analyses expressed in this newsletter are based on Curi Capital, LLC’s (“Curi Capital”) research and professional experience are expressed as of the date of our mailing of this newsletter. Certain information expressed represents an assessment at a specific point in time and is not intended to be a forecast or guarantee of future results, nor is it intended to speak to any future time periods. Curi Capital makes no warranty or representation, express or implied, nor does Curi Capital accept any liability, with respect to the information and data set forth herein, and Curi Capital specifically disclaims any duty to update any of the information and data contained in this newsletter. The information and data in this newsletter does not constitute legal, tax, accounting, investment or other professional advice. Returns are presented net of fees. An investment cannot be made directly in an index. The index data assumes reinvestment of all income and does not bear fees, taxes, or transaction costs. The investment strategy and types of securities held by the comparison index may be substantially different from the investment strategy and types of securities held by your account.