
Key Takeaways
- U.S. large-cap stocks rose 8% in the third quarter while small caps gained 12%, reaching their highest levels since November 2021. U.S. intermediate-term bonds ended the quarter up 2%.
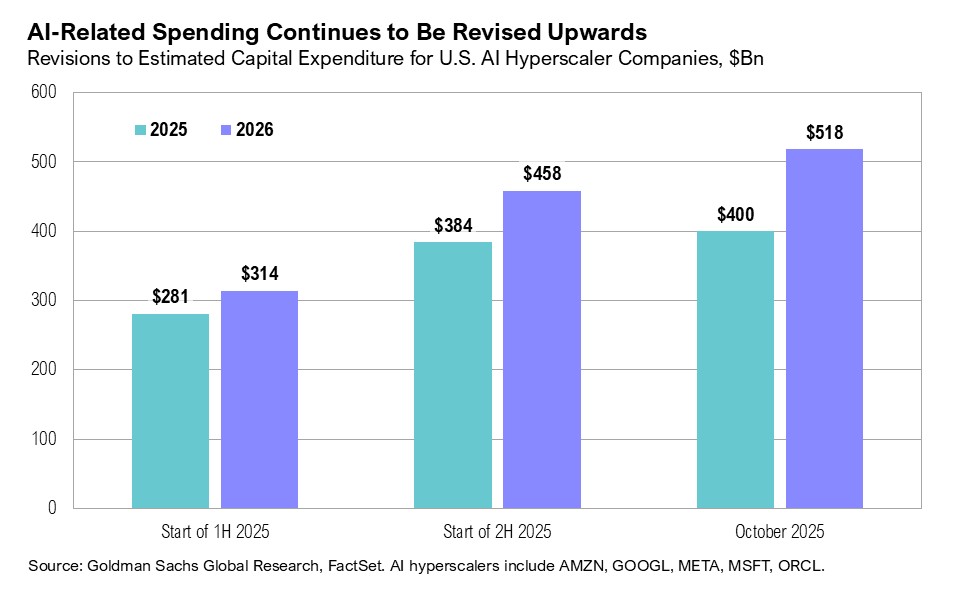
- Since ChatGPT’s launch, mega-cap tech companies have more than doubled their AI-related capital expenditures, and hyperscalers are expected to spend $340 billion on AI in 2025.
- On September 17, with inflation floating above its official 2% target, the Federal Reserve cut interest rates by 0.25%, citing labor market concerns and a slowdown in economic activity.
- The Fed’s dual mandate—to balance price stability with maximum employment—now seems suspended somewhere between caution, cutting rates at the first sign of labor softening, and complacency, easing policy while inflation remains above target.
- The Fed’s decisions come while the market appears increasingly bubble-like, with exciting developments in AI, among other areas, but growing signs of excess.
Overview
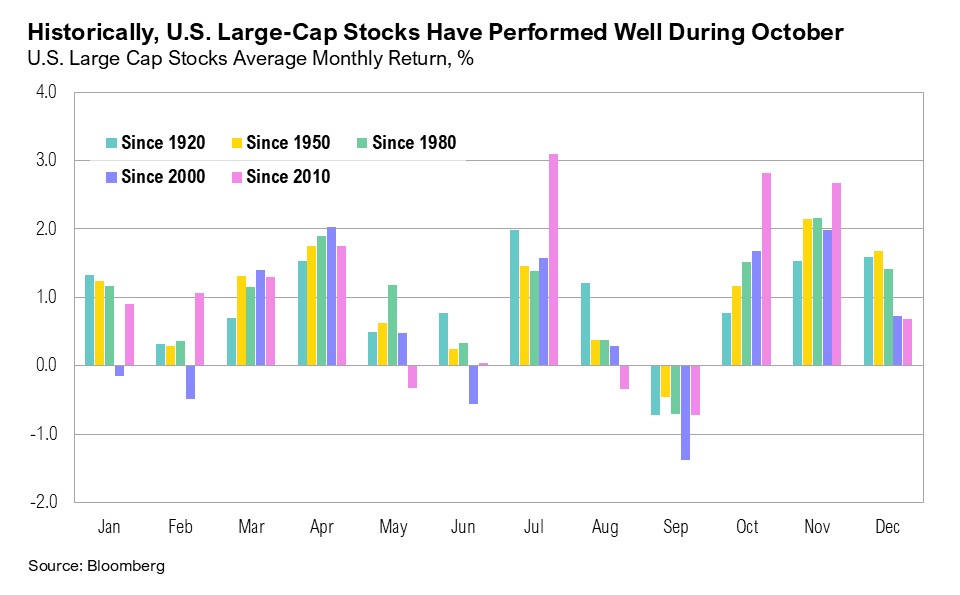
U.S. large-cap stocks, as measured by the S&P 500 index, gained 2.3% in October. Since 2000, October returns for U.S. large-cap stocks have averaged 1.7%, making 2025 a year of relatively strong monthly performance. The Russell 2000, an index of U.S. small-cap stocks, gained 1.8% over the month. U.S. intermediate-term bonds, as proxied by the Bloomberg U.S. Aggregate Bond Index, finished October up 0.6%.
Emerging from Shutdown
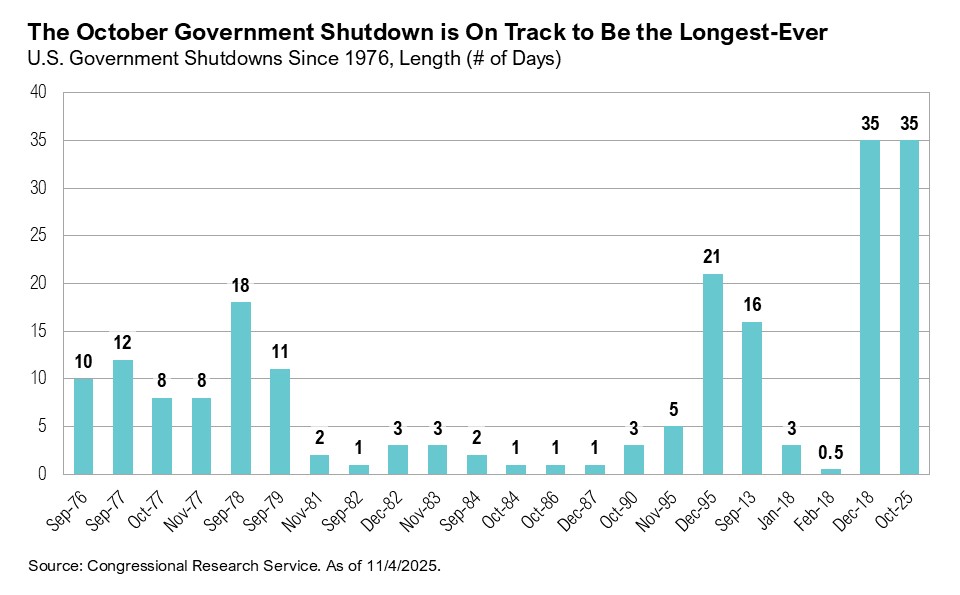
The U.S. government shutdown, triggered by unresolved budget disputes, took effect on October 1. As a result, certain government services were suspended, and roughly 40% of the federal workforce (about 750,000 employees) were furloughed without pay. The dispute centered on disagreements over tax credits, Medicaid funding, and agency budgets. The Senate was unable to reach an agreement despite multiple votes forcing the shutdown. This marked the 21st funding gap and the 11th government shutdown in modern U.S. history. The shutdown delayed and disrupted key economic data releases from agencies such as the Bureau of Labor Statistics, the Bureau of Economic Analysis, and the Department of the Treasury, leaving markets, investors, and the Federal Reserve in the dark. The government shutdown ended on November 12 and was the longer shutdown in U.S history.1,2
Key Takeaways
- U.S. large-cap stocks gained 2.3% in October while small-cap stocks rose 1.8%. U.S. intermediate-term bonds increased by 0.6%.
- Third-quarter earnings have been broadly positive. Eighty-three percent of companies beat expectations, and overall quarterly earnings growth forecasts rose to 11%. The technology sector remains a key driver.
- Despite the dearth of official government economic data during the government shutdown, the Federal Reserve lowered interest rates by 0.25%, but tempered expectations for a December cut.
- Artificial intelligence remains a dominant market theme, and there is a reasonable debate over whether current enthusiasm reflects an AI bubble or a sustained transformational growth opportunity.
Overview
U.S. large-cap stocks, as measured by the S&P 500 index, gained 2.3% in October. Since 2000, October returns for U.S. large-cap stocks have averaged 1.7%, making 2025 a year of relatively strong monthly performance. The Russell 2000, an index of U.S. small-cap stocks, gained 1.8% over the month. U.S. intermediate-term bonds, as proxied by the Bloomberg U.S. Aggregate Bond Index, finished October up 0.6%.

Emerging from Shutdown
The U.S. government shutdown, triggered by unresolved budget disputes, took effect on October 1. As a result, certain government services were suspended, and roughly 40% of the federal workforce (about 750,000 employees) were furloughed without pay. The dispute centered on disagreements over tax credits, Medicaid funding, and agency budgets. The Senate was unable to reach an agreement despite multiple votes forcing the shutdown. This marked the 21st funding gap and the 11th government shutdown in modern U.S. history. The shutdown delayed and disrupted key economic data releases from agencies such as the Bureau of Labor Statistics, the Bureau of Economic Analysis, and the Department of the Treasury, leaving markets, investors, and the Federal Reserve in the dark. The government shutdown ended on November 12 and was the longer shutdown in U.S history.1,2
The September inflation report was the only official economic release permitted during the shutdown, as it serves as the benchmark for cost-of-living adjustments (COLA) in benefit payments.3 It showed headline inflation rising from 2.9% to 3.0% year-over-year and reaching the highest level since May 2024.4 Shelter costs, while still elevated at 3.6% year-over-year, increased at their slowest pace since November 2021.4 Overall, headline inflation has remained sticky, averaging 3.0% since June 2023.
Although official Bureau of Labor Statistics payroll and other labor market data have been suspended, state-level initial jobless claims continued to be reported throughout the government shutdown. According to J.P. Morgan, aggregated state-level initial claims have remained steady, easing from around 219,000 to 205,000 in the week ending October 25.5 For context, the last officially reported national figure was 218,000 for the week ending September 20.6 During the October 29 Federal Open Market Committee (FOMC) meeting, Federal Reserve Chair Jerome Powell noted that:
“We’ll have a picture of what’s going on in the labor market. And the fact that we’re not seeing an uptick in claims, or a downtick really in openings, suggests that you’re seeing maybe continued very gradual cooling [of the labor market], but nothing more than that. So that does give you some comfort.”7
With inflation back at 3% and the labor market showing signs of only “very gradual cooling,” the Federal Reserve cut interest rates at the October 29 FOMC meeting, bringing rates to the range of 3.75% to 4.0%.7 Fed Chair Powell sought to temper expectations for a follow-up cut in December by saying that a “further reduction in the policy rate at the December meeting is not a forgone conclusion—far from it.”7 Nevertheless, market-implied probabilities at the end of October still placed the likelihood of a December cut at 70%.8
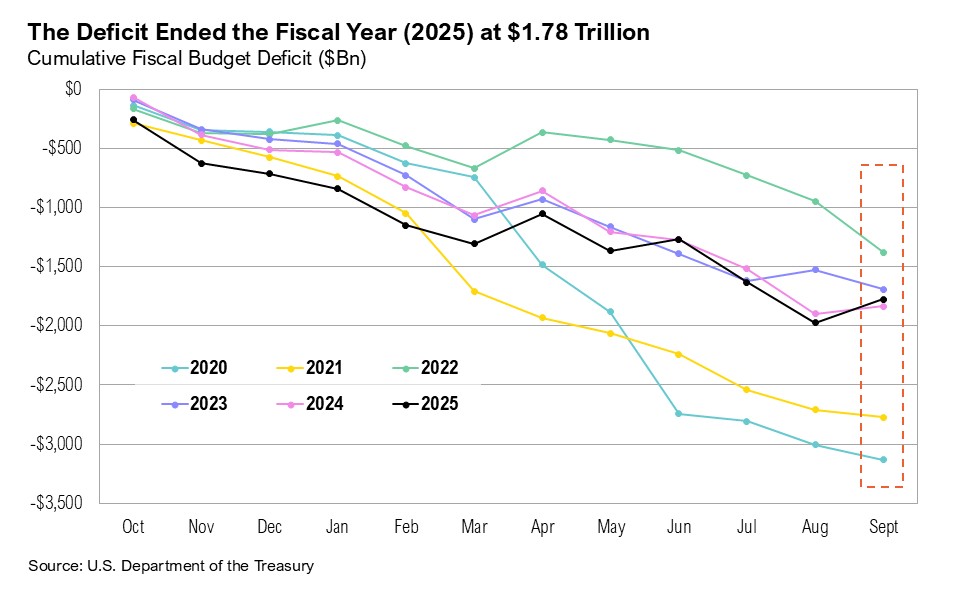
Monetary policy will likely remain supportive, particularly since inflation has hovered between 2.4% and 3.7% for the past 27 months—chronically above the Fed’s 2% inflation target. Further, lower interest rates provide an immediate benefit to the ever-present U.S. fiscal debt burden. On October 16, the full fiscal 2025-year Treasury statement was released. It showed the fiscal deficit reaching $1.76 trillion in 2025, a marginal improvement over the $1.83 trillion deficit racked up in 2024.9 The modest improvement was largely due to a boost in tariff revenues: $30 billion was collected in September, which contributed to the largest September surplus on record of $197.9 billion.9,10 On November 5, the Trump administration headed to the Supreme Court to defend the legality of the April 2 “Liberation Day” tariffs.11 If the court rules them invalid , billions in tariff revenue may have to be refunded to trade partners. Net interest payments—which would benefit from lower interest rates—rose to $970 billion in the 2025 fiscal year, up from $882 billion in 2024.9
While markets (and the Fed) may have been left in the dark without any economic data to guide expectations and policy views (thus complicating both investment decisions and the Fed’s future interest rate deliberations), the third-quarter earnings season has thus far been a treat for most investors. As of the end of October, more than 60% of companies had reported results, and 83% of companies exceeded expectations.12
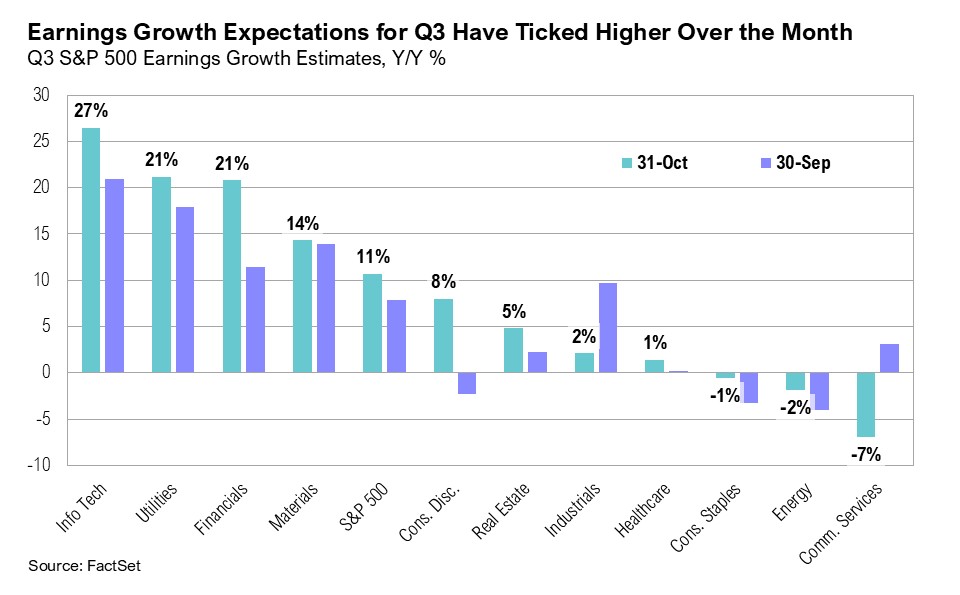
Earnings growth expectations for the third quarter notably improved through October, rising from 8% at the end of September to 11% by month-end. Information technology (+27%) and utilities (+21%) are expected to drive overall earnings growth.12 Despite beating expectations, Meta’s share price fell more than 10% after it recorded a one-time, non-cash income tax charge related to the implementation of the “One Big Beautiful Bill.” This charge reduced the company’s earnings per share, which in turn pulled down the communication services sector’s third-quarter earnings expectations from +3% to -7%.12 Excluding Meta, the sector would be showing a 13% year-over-year increase.12 Looking ahead, full-year S&P 500 earnings growth expectations continue to edge higher, rising from 10.7% at the end of September to 11.2% by the end of October.12 Full-year 2026 earnings for the S&P 500 are currently projected to rise by 14%. U.S. small-cap stocks, which have gained 12% year to date, are also expected to see strong earnings growth. Russell 2000 earnings are expected to rise by 27% in 2025, and by a notable 40% in 2026.
Meta, Amazon, Microsoft, and Alphabet all reported earnings in October. Artificial intelligence–related capital expenditures (capex) remained a dominant theme across earnings calls, and all four companies signaled plans to increase their spending in 2026. Together, Meta, Amazon, Microsoft, and Alphabet—some of the largest U.S. AI hyperscalers—reported a combined $100 billion in capex during the third quarter of 2025 and an estimated $384 billion year to date. Looking ahead, these companies show no signs of slowing their investments. Meta’s management noted that their “current expectation is that capex dollar growth will be notably larger in 2026 than 2025,” while Alphabet executives said they “expect a significant increase in capex.”13,14 Similarly, Amazon stated in its earnings call that it “expects full-year cash capex to be approximately $126 billion in 2025, and that amount will increase in 2026.”15 Microsoft’s CFO, Amy Hood, added that “…total spend will increase sequentially, and we now expect the full-year 2026 growth rate to be higher than 2025.”16
Other insights from company earnings calls have thus far revealed interesting consumer spending-related trends. Most notably, both Visa and Mastercard highlighted the resilience of consumers. According to Visa CFO Christopher Suh:
“U.S. payments volume was up 8%…reflecting resilience in consumer spending. We saw a broad-based strength, including improvements in retail services and goods, travel, and fuel.”17
Mastercard CFO Sachin Mehra echoed a similar sentiment, pointing to healthy consumer spending across income cohorts:
“What we’re seeing is continued steady growth, both across affluent and mass market, through in the U.S. through across the globe. So overall, the consumer continues to spend.”18
According to Bank of America’s consumer insight report, total credit and debit card spending increased by 2% year-over-year in September.19 However, the report notes that the difference in the pace of spending between low-income spending (at 0.6% year-over-year in September) relative to high-income spending (2.6% year-over-year) remains stark.19 The Johnson Redbook Index, which measures weekly same-store sales growth at large U.S. retailers, posted a robust 5.2% year-over-year increase in the last week of October.20 The index has been steady, hovering between 4% and 7% since March 2024.
Markets
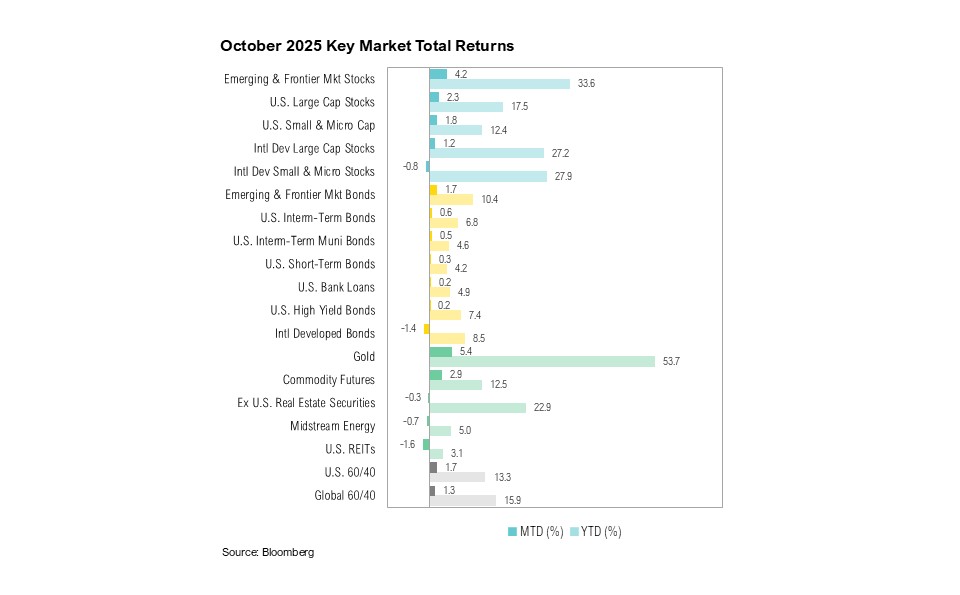
U.S. large-cap stocks ended October up 2.3%, outperforming foreign peers by 1.1% as international developed market stocks ended the month up 1.2%. U.S. small-cap stocks gained 1.8% over the month while developed market small-cap stocks ended October down 0.8%. Emerging market stocks gained 4.2%.
The 10-year Treasury yield eased to 3.95% on October 22. Then, after Fed Chair Powell’s post-FOMC press conference comment that a December interest rate cut was “far from” a forgone conclusion, it rose back above 4%, where it remained for the rest of the month. Despite credit concerns in the U.S. banking sector stemming from alleged fraud at two auto companies (Tricolor and First Brands), bank credit default swaps remained contained relative to history. In addition, high-yield spreads ended the month at 2.78%. These signs indicate that the developments were idiosyncratic and do not reflect broader systemic issues.
Gold, which remains a top performer year to date (gaining 54% since January), ended the month up 5.4%, and reached a new record high of $4,366 per ounce on October 20. After dropping to $56 per barrel, West Texas Intermediate (WTI) crude oil prices ended October back above $60 per barrel while national average gas prices eased to the lowest price for this time of year in five years.
At the end of October, U.S. President Trump held key trade talks with both Japan and China. The U.S. and Japan announced a $550 billion deal that will see Japanese investment in industries such as energy infrastructure, AI, and critical minerals.21 Japan has also committed to tariff adjustments and the opening of markets that benefit both countries. Meanwhile, the U.S.–China agreement marks a tactical truce that includes tariff reductions, a suspension of export controls on rare earths essential to U.S. industry, and resumed Chinese purchases of U.S. agricultural products.22 Although the U.S.–China deal provides breathing room to avoid supply chain disruption and trade damage, as well as raises hope for improved trade dialogue, it has been widely viewed as a tactical pause rather than a comprehensive solution to the trade imbalances between the two countries.
Looking Forward
While government shutdowns have historically had limited market impact, the duration of the recent shutdown intensified the sense of disruption and spurred consternation among investors. That said, its resolution will likely calm markets and allow a vast amount of money to continue to flow from government coffers. Bond yields, a pivotal signal, are in a curious balance, caught between a softening labor and housing market on one side and continued elevated inflation on the other. Investors also need to consider the potential for the Fed to become increasingly supportive as we head into 2026. After the Fed cut rates at the October 29 FOMC meeting, Treasury Secretary Scott Bessent noted:
“The decision to cut rates by 25 basis points, I applaud. But the language that went with it tells me that this Fed is stuck in the past. Their inflation estimates have been terrible so far this year. They keep coming down, inflation keeps coming down, and their models are broken. And I’m just not sure what they’re thinking here in terms of signaling that they may not want to cut rates at the December meeting. They’ve got a lot to answer for, not only for this year but for many years past, both in their GDP estimates and their inflation estimates, which are consistently wrong. And we’re going to find a leader who is going to revamp the entire institution in terms of process and inner workings.”23
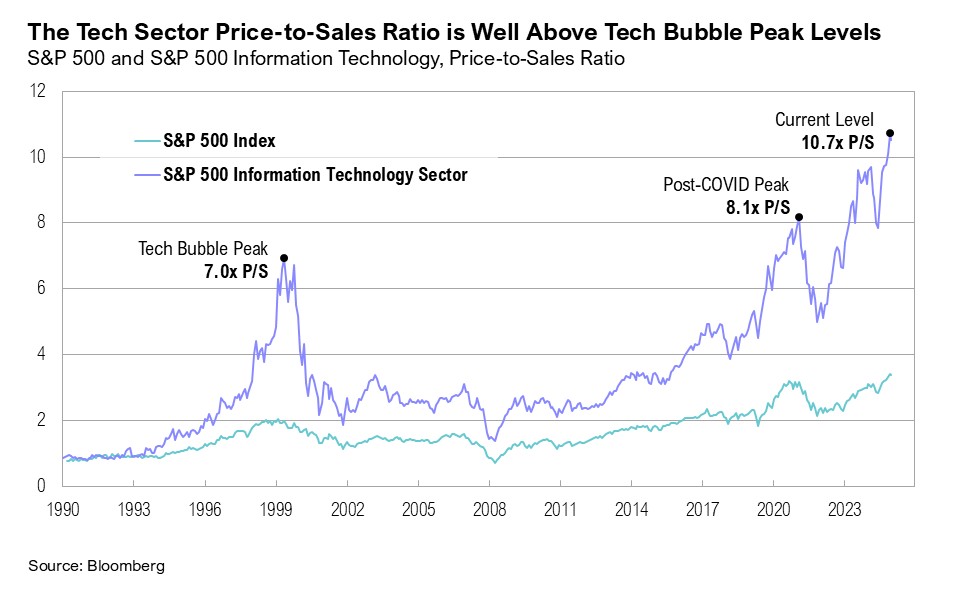
Artificial intelligence remains a dominant market theme, and there is a reasonable debate over whether current enthusiasm reflects an AI bubble or a sustained transformational growth opportunity. On one hand, technology sector valuations keep climbing, and the price-to-sales (P/S) ratio ended October well above Tech Bubble levels. The S&P 500 information technology sector now trades at 10.7x sales, compared with a peak of 7.0x in the early 2000s.
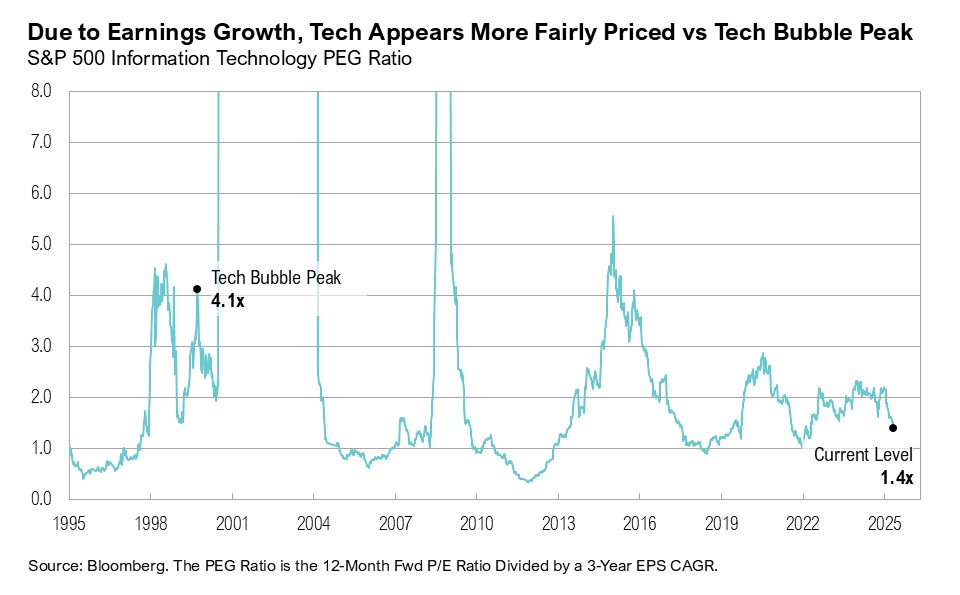
On the other hand, when valuation is adjusted for earnings growth, the sector looks less extreme. Using one version of a PEG ratio—price-to-earnings divided by three-year trailing earnings growth—the sector stands at 1.4x versus roughly 4.1x at the height of the Tech Bubble. This oversimplified contrast doesn’t settle the debate, but it highlights one defining feature of the bull market: earnings growth remains key.
For the S&P 500, earnings per share (EPS) fell 1% year-over-year in 2023, rose 8% in 2024, and are projected to increase 14% in 2025 and 13% in 2026. In the information technology sector, EPS declined 0.6% in 2023, rebounded 18% in 2024, and is expected to surge 33% in 2025 and 23% in 2026. While it is not guaranteed, continued earnings growth and the prospect of substantially easier policy should encourage investors to patiently stay the course, albeit in diversified portfolios.
Recent market exuberance feels on the verge of irrationality. Investors are forced to balance complacent equity allocations with stretched valuations. Historically, time in the market beats timing the market. The longer the holding period, the more consistent the results. However, entry valuations are critical: buying securities when valuations are low has, on average, generated better performance over the long-run than buying when valuations are high, and valuations are unambiguously high. This all suggests some caution, even acknowledging that bubbles are unpredictable.
That said, there are segments of the capital markets that have been ignored, even as others have roared ahead this year. As for the parts of the market that may have been left behind, we will gradually and very incrementally reallocate to asset classes and companies that have been out of favor and we believe offer the best risk-adjusted returns, acknowledging that no one knows exactly how this will play out.
Citations
1. Polymarket: https://polymarket.com/event/when-will-the-government-shutdown-end-545?tid=1762859519215
2. Kalshi: https://kalshi.com/markets/kxgovshutlength/days-of-government-shutdown/kxgovshutlength-26jan01
3. CNBC: https://www.cnbc.com/2025/10/24/cpi-inflation-september-2025.html
4. Bureau of Labor Statistics: https://www.bls.gov/news.release/cpi.nr0.htm
6. Federal Reserve Bank of St. Louis: https://fred.stlouisfed.org/series/ICSA
7. Federal Reserve: https://www.federalreserve.gov/mediacenter/files/FOMCpresconf20251029.pdf
8. CME FedWatch: https://www.cmegroup.com/markets/interest-rates/cme-fedwatch-tool.html
9. Department of the Treasury: https://www.fiscal.treasury.gov/files/reports-statements/mts/mts0925.pdf
10. Bloomberg data series (tariff revenues)
11. Wall Street Journal: https://www.wsj.com/livecoverage/supreme-court-tariffs-case-stock-market-11-05-2025/card/how-the-individual-justices-stand-on-tariffs-and-how-they-acted-in-the-hearing-tMIn9L1MoBU7YZm3avJF
13. Meta: https://s21.q4cdn.com/399680738/files/doc_financials/2025/q3/Meta-09-30-2025-Exhibit-99-1-Final.pdf
14. Alphabet: https://abc.xyz/investor/events/event-details/2025/2025-Q3-Earnings-Call-2025-4OI4Bac_Q9/default.aspx
15. Morningstar: https://www.morningstar.com/stocks/xnas/amzn/earnings-transcripts
16. Morningstar: https://www.morningstar.com/stocks/xlim/msft/earnings-transcripts
18. Morningstar: https://www.morningstar.com/stocks/xber/m4i/earnings-transcripts
19. Bank of America: https://institute.bankofamerica.com/content/dam/economic-insights/consumer-checkpoint-october-2025.pdf
20. MacroMicro: https://en.macromicro.me/charts/23462/us-redbook-same-store-index
21. Reuters: https://www.reuters.com/world/asia-pacific/trump-takaichi-agree-rare-earth-critical-minerals-supply-2025-10-28/
22. CNN: https://edition.cnn.com/2025/10/27/business/us-china-trade-talk-malaysia-intl-hnk
Index Definitions
The S&P 500 Index is widely regarded as the best single gauge of the United States equity market. It includes 500 leading companies in leading industries of the U.S. economy. The S&P 500 focuses on the large cap segment of the market and covers approximately 75% of U.S. equities.
The Bloomberg Barclays U.S. Aggregate Index represents securities that are SEC-registered, taxable, and dollar denominated. The index covers the U.S. investment grade fixed rate bond market, with index components for government and corporate securities, mortgage pass-through securities, and asset-backed securities. Duration is roughly 5 years.
The Bloomberg U.S. Corporate High Yield Bond Index measures the USD-denominated, high yield, fixed-rate corporate bond market. Securities are classified as high yield if the middle rating of Moody’s, Fitch and S&P is Ba1/BB+/BB+ or below. Bonds from issuers with an emerging markets country of risk, based on the indices’ EM country definition, are excluded.
The Russell 2000® Index measures the performance of the small-cap segment of the US equity universe. It includes approximately 2000 of the smallest US equity securities in the Russell 3000 Index based on a combination of market capitalization and current index membership. The Russell 2000 Index represents approximately 10% of the total market capitalization of the Russell 3000 Index. Because the Russell 2000 serves as a proxy for lower quality, small cap stocks, it provides an appropriate benchmark for RMB Special Situations.
The U.S. Dollar Index is used to measure the value of the dollar against a basket of six foreign currencies: the euro, Swiss franc, Japanese yen, Canadian dollar, British pound, and Swedish krona.
MSCI U.S. REIT Index is a free float-adjusted market capitalization weighted index that is comprised of equity Real Estate Investment Trusts (REITs). The index is based on the MSCI USA Investable Market Index (IMI), its parent index, which captures the large, mid and small cap segments of the USA market. With 150 constituents, it represents about 99% of the US REIT universe and securities are classified under the Equity REITs Industry (under the Real Estate Sector) according to the Global Industry Classification Standard (GICS®), have core real estate exposure (i.e., only selected Specialized REITs are eligible) and carry REIT tax status.
Sources
*Source: MSCI.MSCI makes no express or implied warranties or representations and shall have no liability whatsoever with respect to any MSCI data contained herein. The MSCI data may not be further redistributed or used as a basis for other indexes or any securities or financial products. This report is not approved, endorsed, reviewed or produced by MSCI. None of the MSCI data is intended to constitute investment advice or a recommendation to make (or refrain from making) any kind of investment decision and may not be relied on as such.
Disclaimers
Performance Disclosures
All market pricing and performance data from Bloomberg, unless otherwise cited. Asset class and sector performance are gross of fees unless otherwise indicated.
The opinions and analyses expressed in this newsletter are based on Curi Capital, LLC’s (“Curi Capital”) research and professional experience are expressed as of the date of our mailing of this newsletter. Certain information expressed represents an assessment at a specific point in time and is not intended to be a forecast or guarantee of future results, nor is it intended to speak to any future time periods. Curi Capital makes no warranty or representation, express or implied, nor does Curi Capital accept any liability, with respect to the information and data set forth herein, and Curi Capital specifically disclaims any duty to update any of the information and data contained in this newsletter. The information and data in this newsletter does not constitute legal, tax, accounting, investment or other professional advice. Returns are presented net of fees. An investment cannot be made directly in an index. The index data assumes reinvestment of all income and does not bear fees, taxes, or transaction costs. The investment strategy and types of securities held by the comparison index may be substantially different from the investment strategy and types of securities held by your account.