
Key Takeaways
- U.S. large-cap stocks ended the second quarter up 10.9%, marking a new record high. U.S. small-cap stocks gained 8.5%, and U.S. intermediate-term bonds ended the quarter up 1.2%.
- The Big Beautiful Bill includes permanent Tax Cuts and Jobs Act extensions, tax relief for middle-income earners, and a new tax cut on tipped income and overtime.
- As the bill moved through Congress, the all-important Treasury market remained relatively calm. However, yields on longer maturity bonds priced in incrementally higher risk premiums.
Overview
The quarter began not with a fizzle, but with a bang. On April 2, the U.S. government announced sweeping tariffs: a baseline 10% on nearly all imports and higher rates targeting specific countries. 1,2 This brought the average U.S. tariff rate to 22.5% (from an average of around 2.4%)—the highest level in over a century. 3,4 On April 9, a 90-day pause on the tariffs was announced. 5 The pause was driven by volatility in Treasury markets: the 10-year Treasury yield saw its largest weekly increase since 2001, rising from 4.0% to 4.5% while the longer-term 30-year yield jumped from 4.4% to 4.9%, its largest five-day rise since April 1987. White House National Economic Council Director Kevin Hassett noted that:
“There’s no doubt that the Treasury market made it so that the decision about the time to move [on the tariff pause] was made with, I think perhaps, a little more urgency.” 6
Over the quarter, several trade deals were struck between the U.S. and major trading partners. On June 26, a deal with China focused on the shipment of rare earth minerals to the U.S., part of a broader effort to resolve ongoing trade tensions. 7 The European Union continues to push for a universal 10% tariff on exports to the U.S. while seeking exemptions for pharmaceuticals, semiconductors, and aircraft, among others. 8 In early July, the U.S. announced a trade deal with Vietnam. Under the agreement, the U.S. will place a 20% duty on Vietnamese imports and U.S. exports to Vietnam will not be subject to any tariffs. 9,10 Vietnam has also agreed to a 40% duty on goods originating in other countries but routed through Vietnam for final shipment to the U.S.—a tactic reportedly used by China. 10
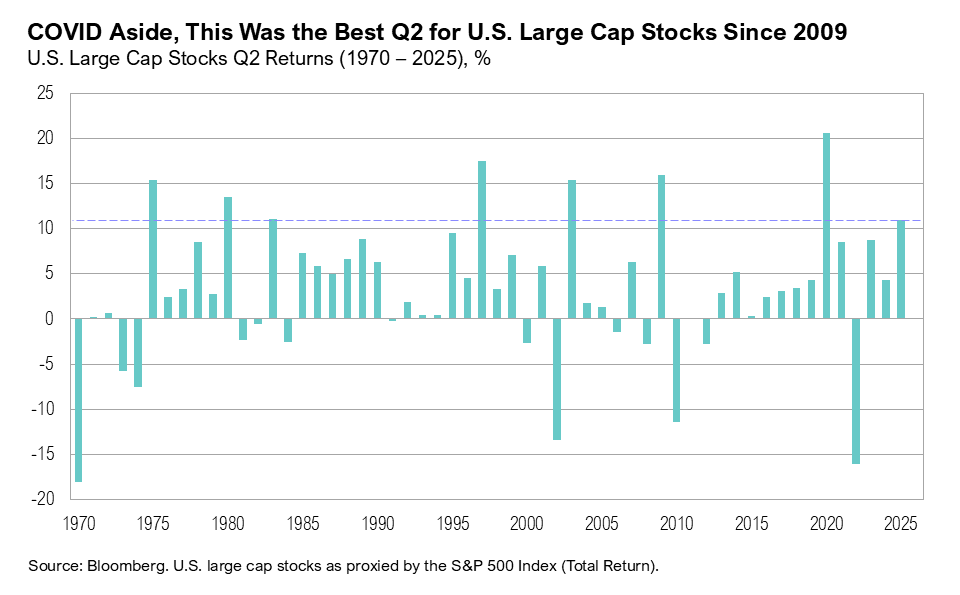
Despite a 20% drawdown to start the quarter, U.S. large-cap stocks, as measured by the S&P 500 Index, ended June up 10.9%, and closed the quarter at a new record high, marking the best second-quarter return for the index since 2009, aside from 2020. U.S. small-cap stocks gained 8.5% over the quarter. U.S. intermediate-term bonds, as proxied by the Bloomberg U.S. Aggregate Bond Index, ended the quarter up 1.2%.
June marked three years since year-over-year headline inflation reached a four-decade high of 9.1%. Since then, inflation has gradually trended toward the Federal Reserve’s official 2% target. In May, headline inflation eased to 2.4% year-over-year while core inflation held steady at 2.8%. 11 Shelter costs remain the largest contributor to elevated prices. 11 At its June Federal Open Market Committee (FOMC) meeting, the Fed reiterated its preference to keep interest rates on hold for now while maintaining expectations for two rate cuts before year-end. 12 Markets are currently pricing in the equivalent of two to three rate cuts by December 2025. 13
The labor market continues to soften but remains resilient, supporting the Fed’s preference to hold off on rate cuts. Over the past three months, the U.S. economy added 449,000 new jobs, and the unemployment rate remains near historic lows at 4.1%. 14 Wage growth remains above pre-pandemic levels, increasing by 3.7% year-over-year in June. The most recent JOLTS (Job Openings and Labor Turnover Survey) showed that vacancies in May rose to the highest level since November 2024 and remain well above pre-pandemic levels. 15
Fireworks
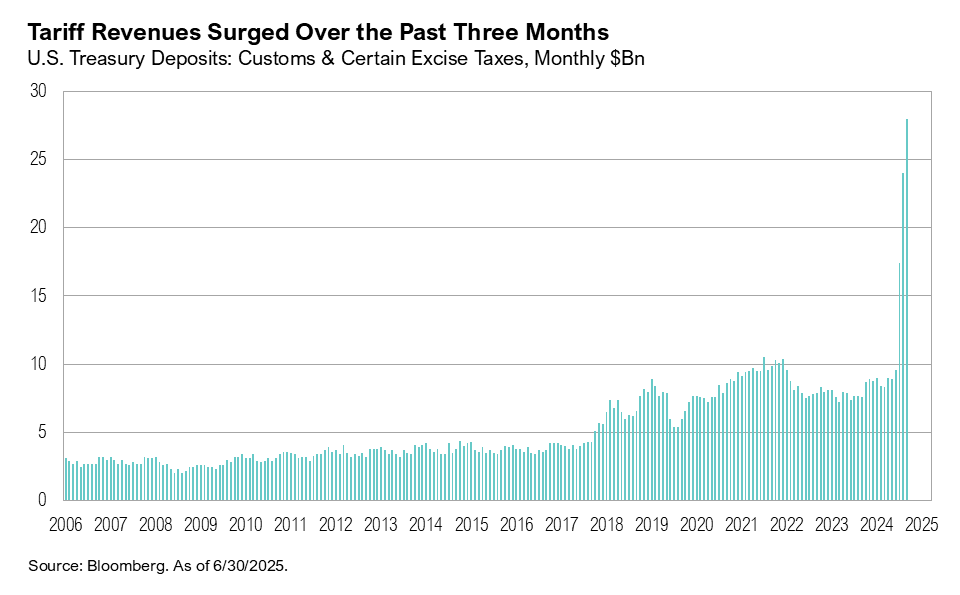
One of the key motivations behind the tariff hikes was to boost government revenue. June saw a record $28 billion collected in customs and excise taxes. In the first half of 2025, the U.S. has collected $97 billion in tariff revenue, already matching the total annual revenue from tariffs in 2024. 16 Estimates show that the cost of extending the Tax Cuts and Jobs Act (TCJA) provisions, which are set to expire at the end of the year, could increase the fiscal deficit by between $4 trillion and $4.6 trillion over the next decade. 17,18 Tariff revenue, which the Penn-Wharton budget model estimates could exceed $200 billion per year, might offset nearly half the estimated cost of extending the TCJA. 19 Extending the TCJA has been a key priority for the government. Failing to extend the TCJA would result in higher taxes and leave households with less disposable income. According to Charles Schwab Chief Investment Strategist Liz-Ann Sonders, not getting the 2017 tax cuts extended “would be a huge economic hit.” 20
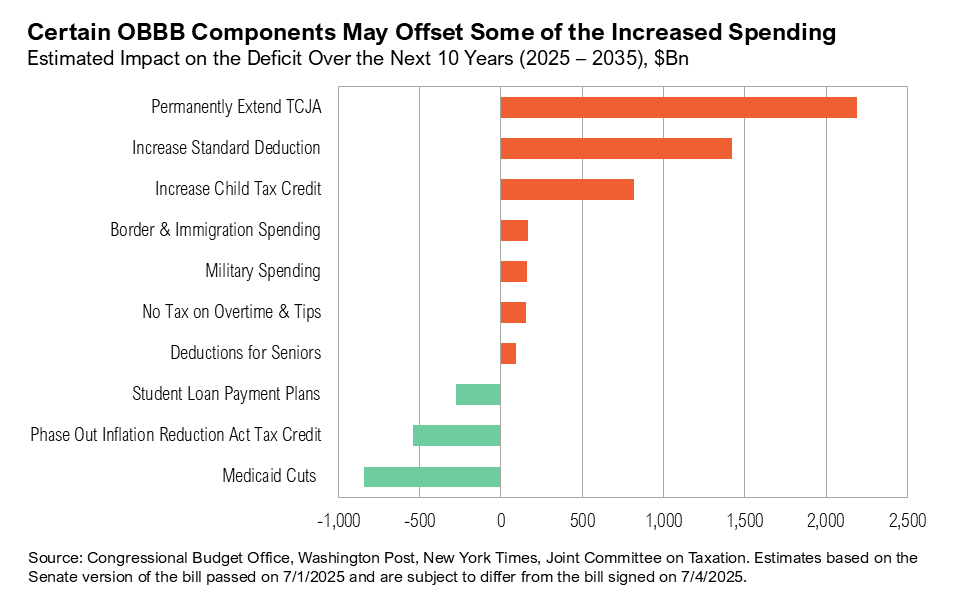
The Tax Cuts and Jobs Act forms a central part of the One Big Beautiful Bill, a budget reconciliation package that permanently extends nearly all major provisions of the TCJA, while also cutting taxes on tips and Social Security payments and cuts to Medicaid. The One Big Beautiful Bill (OBBB) was passed in Congress on Thursday, July 3, and signed into law on Friday, July 4. The Congressional Budget Office (CBO) estimates that the bill would add $3.3 trillion to the federal deficit over the next decade. 21 Lawmakers from both political parties have pushed back on the CBO’s estimates: Republicans argue that it understates growth (the CBO estimates 1.8% year-over-year GDP growth) and overstates the deficit impact while Democrats say the methodology is too generous toward temporary provisions and doesn’t fully reflect long-term fiscal risks. 21,22,23
Medicaid cuts are one of the largest offsets in the spending bill. Estimates project that it could reduce the cost of extending the TCJA by nearly $1 trillion. 24,25 Between 2020 and 2023, Medicaid spending surged by 42%. 26 The OBBB introduces stricter eligibility requirements for Medicaid recipients and limits how states can fund the program. 27 Changes include requiring recipients to work at least 80 hours per month and mandating redetermination of eligibility twice a year. 27,28 The effects may not immediately impact providers or patients. Experts caution that the most significant impacts could emerge around 2028. 29 Other offsets to the spending bill are changes to student loan repayment rules and the phase-out of Inflation Reduction Act tax credits (which are expected to reduce the cost of the OBBB by over $500 billion over the next decade).
One unique feature of the OBBB is its elimination of federal taxes on tipped income and overtime pay. It is estimated that between 2.5 and 5.2 million tipped workers stand to benefit, potentially boosting their collective income by $39 billion over the next decade. 30,31 According to Yale’s Budget Lab, these workers could see annual tax cuts ranging from $1,700 to $5,800. 32 However, the bottom 20% of earners would receive much smaller cuts of around $74 per year, largely because their incomes are already below the taxable threshold. 31 The benefits are currently set to expire in 2028, do not apply to individuals earning more than $150,000 per year, and are capped at $25,000 in total deductions. 32,33 The OBBB also allows certain workers to claim a tax deduction for qualified overtime pay, subject to limits similar to those applied to tipped income. 33 According to the Social Security Administration, the OBBB “ensures that nearly 90% of Social Security beneficiaries will no longer pay federal income taxes on their benefits.” 34
The OBBB also includes broader tax relief. Individuals earning between $30,000 and $80,000 per year are likely to see tax bills reduced by nearly 15%, and the child tax credit is set to be permanently increased to $2,200. 35,36 The OBBB will also make the small-business tax deduction permanent, and provisions such as immediate expensing for new domestic factories and support for manufacturing are aimed at increasing domestic investment and job creation. 37,38,39 Companies will benefit from expanded provisions around itemization and expenses, including a return of 100% bonus depreciation, letting businesses deduct the full cost of investments upfront, rather than spreading it out over three years. 39
Bond markets have shown signs of caution as the bill progressed through Congress, especially in longer maturity bonds. Shorter-term Treasury yields remained relatively calm throughout June as the bill moved through the House and Senate, however longer-term Treasury yields drifted higher coincident with fiscal concerns related to tariffs and the budget bill. Credit markets responded somewhat similarly, with credit spreads widening for a period of time before the Federal Reserve stepped in to help ease concerns.
Markets
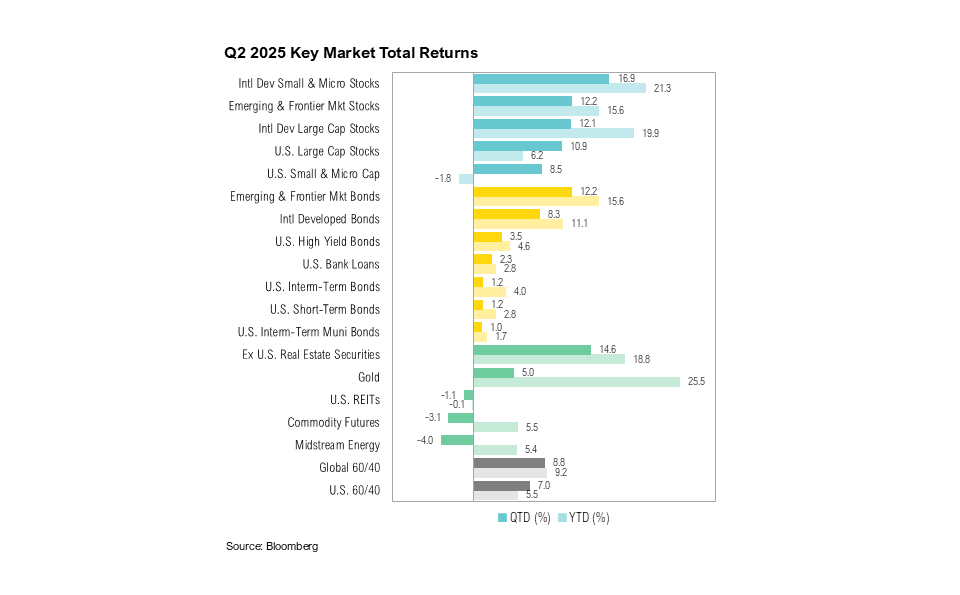
International equity markets outperformed their U.S. counterparts in the second quarter. International developed market large-cap stocks ended the quarter up 12.1% while U.S. large-cap stocks gained an impressive 10.9% considering the S&P 500 experienced a 20% drawdown in the opening days of the quarter. International developed small-cap stocks gained 16.9% over the quarter, making them the top-performing major asset class. U.S. small-cap stocks ended June up 8.5% and remain in the red year-to-date (down 1.8%).
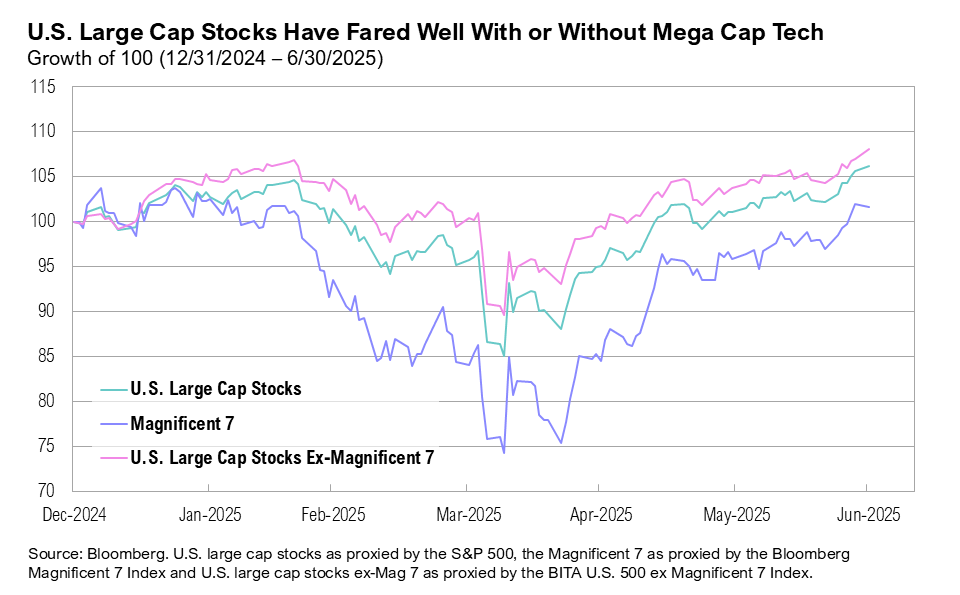
The rally in U.S. equities no longer appears to be driven solely by the Magnificent Seven, as gains among U.S. large-cap stocks have broadened, pushing the market to new highs. Year-to-date, the S&P 500 has outperformed the Bloomberg Magnificent 7 Index (Apple, Alphabet, Amazon, Microsoft, Meta, Nvidia, and Tesla) by 5%, with the former gaining 6% year-to-date and the latter ending the first six months of 2025 up 2%.
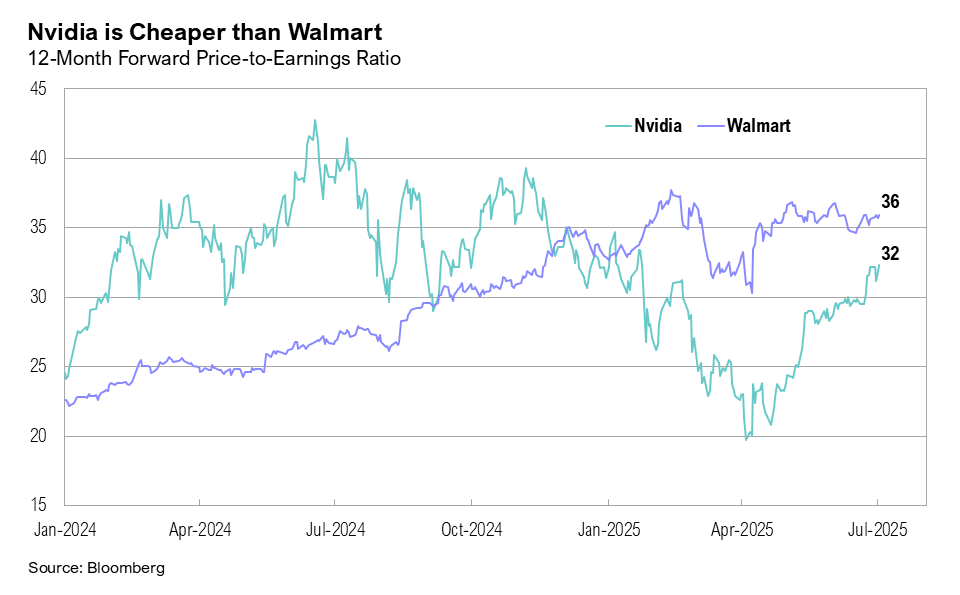
Full-year S&P 500 earnings growth estimates declined over the quarter, falling from 11% to 9%. 40 The technology sector (+18%) and communication services sector (+15%) are expected to lead earnings growth in 2025. 41 The consumer staples sector is experiencing an interesting confluence of growth expectations and valuation metrics. Growth expectations remain modest: revenue in the sector is projected to increase by a total of 8.2%, and earnings per share by 10.6% over the next two years. This puts forward-looking valuations in the sector to near the highest levels seen in at least a decade. In contrast, the technology sector is expected to post significantly better results, with revenue projected to rise by a total of 24.6% and earnings by 37.1% over the next two years. This divergence is perhaps best illustrated with an example: Nvidia, with a forward price-to-earnings (P/E) ratio of 32x, is cheaper than Walmart, which is currently trading at a forward P/E of 36x.
U.S. intermediate-term bonds gained 1.2% in the quarter. After rising to 4.6% in mid-May (following the Moody’s U.S. credit downgrade), the 10-year U.S. Treasury yield ended June at 4.2%. The spread between the 10-year and 2-year Treasury yields remained positive throughout the quarter, ending June at 0.5%.
The second quarter contained more than one geopolitical conflict. Trade wars aside, conflict in the Middle East escalated in June after Israel launched an attack targeting Iran’s nuclear program. The conflict raised geopolitical risk in the region, which is home to key oil producers (and a critical part of global energy supply). Oil prices jumped 8% on June 13, reaching $74 per barrel. On June 24, after nearly two weeks of fighting, a ceasefire between Israel and Iran was brokered by the U.S. after the U.S. bombed Iranian nuclear sites and subsequently applied diplomatic pressure to de-escalate the conflict. 42
Global capital markets showed a muted reaction to conflict, suggesting it was viewed more as an isolated affair and short-term energy price shock rather than a broader systemic risk to global economic growth. West Texas Intermediate (WTI) crude oil prices ended the quarter back at $65 per barrel. The lack of response from U.S. markets also highlighted the U.S.’s advantage as a net exporter of energy, exporting more energy than it imports overall. (It does still import crude oil and remains connected to global energy markets.) 43
Gold, which ended the quarter up 5%, reached a record high of $3,448 on June 16, following Israel-Iran conflict, reaffirming its safe-haven status. Despite conflict in the Middle East, West Texas Intermediate (WTI) crude oil prices declined by 9% over the quarter, dropping from $71.5 per barrel to $65.1 per barrel by the end of June.
Looking Forward
We’ve often pointed to fixed income and credit markets as the best lens for interpreting today’s unusual policy mix. That mix is increasingly defined by near-record fiscal deficits, which have helped support growth and boost risky assets in the past but may not in the future. The bill does raise the federal debt limit, which we hope will give the Treasury some breathing room to stabilize the longer-term debt situation. In the meantime, we believe investors should be prepared for a wide range of outcomes and consider new ways to diversify asset allocations and investment portfolios. Our team will continue to analyze the legislation and assess the impact of the bill from both an investment and planning perspective in the coming weeks.
We expect the increased volatility in markets to continue in the coming weeks and months and remain cautious with risk assets as the current cycle plays out. To guide our views, we will be watching the outcomes of various trade negotiations and how companies respond to the new trade dynamics with business decisions. The Federal Reserve will continue to play a key role and their response to both economic conditions and stress on financial markets is another area to watch.
The range of outcomes remains very wide during this period of uncertainty. No one can predict the future and this is not a time to make big bets or try to time the market. Liquidity is extremely valuable in this environment. Although equity valuations generally remain at above average levels, we would view any pullback in asset prices as a potential opportunity to put additional capital to work. We remain biased towards high-quality companies with strong management teams that will be able to navigate the current environment within our core stock portfolios. We have been well-positioned within core bond portfolios with reduced interest rate and credit risk exposures. We continue to tactically rebalance within asset classes and make changes within individual portfolios. Portfolio level decisions on specific companies and assets are likely to have more clarity than macro views in this environment. As always, we believe clients are best served reminding themselves of the timeless principles of patience and diversification. The key to successful investing is often remaining committed to long-term investment plans.
Citations
- NPR: https://www.npr.org/2025/04/02/nx-s1-5345802/trump-tariffs-liberation-day
- Wall Street Journal: https://www.wsj.com/economy/trade/what-to-know-about-trumps-latest-tariff-policy-moves-8d9f8b37
- World Bank: https://data.worldbank.org/indicator/TM.TAX.MRCH.WM.AR.ZS?locations=US
- Statista: https://www.statista.com/statistics/1557485/average-tariff-rate-all-imports-us/
- CNN: https://edition.cnn.com/2025/04/09/business/reciprocal-tariff-pause-trump
- CNBC: https://www.cnbc.com/2025/04/10/china-trump-tariffs-live-updates.html
- Reuters: https://www.reuters.com/world/china/trump-says-deal-related-trade-was-signed-with-china-wednesday-2025-06-26/
- Bloomberg: https://www.bloomberg.com/news/articles/2025-07-07/eu-rushes-to-conclude-a-framework-trade-deal-with-us-this-week
- Reuters: https://www.reuters.com/world/asia-pacific/trump-says-he-has-struck-trade-deal-with-vietnam-2025-07-02/
- CNBC: https://www.cnbc.com/2025/07/04/trumps-vietnam-pact-targets-china-raises-questions-than-answers.html
- Bureau of Labor Statistics: https://www.bls.gov/news.release/cpi.nr0.htm
- Federal Reserve: https://www.federalreserve.gov/monetarypolicy/files/fomcprojtabl20250618.pdf
- CME FedWatch: https://www.cmegroup.com/markets/interest-rates/cme-fedwatch-tool.html
- Bureau of Labor Statistics: https://www.bls.gov/news.release/empsit.nr0.htm
- Federal Reserve Bank of St. Louis: https://fred.stlouisfed.org/series/JTSJOL
- Bloomberg data series
- Bipartisan Policy Center: https://bipartisanpolicy.org/blog/the-new-cost-for-2025-tax-cut-extensions-4-trillion/
- Committee for a Responsible Federal Budget: https://www.crfb.org/blogs/tax-cut-extensions-would-add-37-trillion-debt-2054
- Penn Wharton Budget Model: https://budgetmodel.wharton.upenn.edu/issues/2025/2/26/tariff-revenue-simulator
- CNBC: https://www.cnbc.com/video/2025/06/30/charles-schwabs-liz-ann-sonders-money-market-funds-arent-an-imminent-source-of-flows-into-equities.html
- Congressional Budget Office: https://www.cbo.gov/publication/61537
- AP: https://apnews.com/article/cbo-big-beautiful-bill-trump-republican-deficit-debt-d432b67a965790e4a26de46ea8db1266
- Foreign Policy: https://foreignpolicy.com/2025/07/04/congressional-budget-office-trump-bill/
- New York Times: https://www.nytimes.com/interactive/2025/06/30/upshot/senate-republican-megabill.html
- Telehealth: https://telehealth.org/blog/medicaid-cuts-and-telehealth-the-latest-on-the-big-beautiful-bill/
- Statista: https://telehealth.org/blog/medicaid-cuts-and-telehealth-the-latest-on-the-big-beautiful-bill/
- NPR: https://www.npr.org/sections/shots-health-news/2025/07/03/nx-s1-5455058/gop-governors-medicaid-cuts-trump-tax-bill
- CNBC: https://www.cnbc.com/2025/06/27/medicaid-cuts-still-in-big-beautiful-bill-after-parliamentarian-ruling.html
- Forbes: https://www.forbes.com/sites/yezensaadah/2025/07/03/heres-when-medicaid-cuts-could-begin-after-house-passes-trumps-megabill/
- Economic Policy Institute: https://www.epi.org/blog/increase-the-minimum-wage-forget-no-tax-on-tips/
- Yale Budget Lab: https://budgetlab.yale.edu/research/no-tax-tips-budgetary-distributional-and-tax-avoidance-considerations
- CNBC: https://www.cnbc.com/2025/07/01/trumps-big-beautiful-bill-would-eliminate-taxes-on-tips.html
- Bankrate: https://www.bankrate.com/taxes/no-tax-on-tips-and-overtime-what-workers-should-know/#no-tax-on-tips
- Social Security Administration: https://www.ssa.gov/news/press/releases/2025/?utm_content=pressrelease&utm_medium=email&utm_source=govdelivery#2025-07-03
- Politico: https://www.politico.com/live-updates/2025/05/13/congress/average-taxpayers-tax-bills-set-to-fall-under-house-tax-package-forecasters-say-00347318
- BBC: https://www.bbc.com/news/articles/c0eqpz23l9jo
- Manufacturing Dive: https://www.manufacturingdive.com/news/industry-leaders-rave-tax-cuts-trump-megabill/752321/
- National Association of Manufacturers: https://nam.org/manufacturers-say-thank-you-34347/?stream=series-press-releases
- Axios: https://www.axios.com/2025/07/03/big-beautiful-bill-health-solar
- FactSet: https://advantage.factset.com/hubfs/Website/Resources%20Section/Research%20Desk/Earnings%20Insight/EarningsInsight_062725C.pdf
- FactSet: https://advantage.factset.com/hubfs/Website/Resources%20Section/Research%20Desk/Earnings%20Insight/EarningsInsight_070325.pdf
- New York Times: https://www.nytimes.com/live/2025/06/24/world/ceasefire-iran-israel-trump
- EIA: https://www.eia.gov/energyexplained/us-energy-facts/imports-and-exports.php
Index Definitions
The S&P 500 Index is widely regarded as the best single gauge of the United States equity market. It includes 500 leading companies in leading industries of the U.S. economy. The S&P 500 focuses on the large cap segment of the market and covers approximately 75% of U.S. equities.
The Bloomberg Barclays U.S. Aggregate Index represents securities that are SEC-registered, taxable, and dollar denominated. The index covers the U.S. investment grade fixed rate bond market, with index components for government and corporate securities, mortgage pass-through securities, and asset-backed securities. Duration is roughly 5 years.
The Bloomberg U.S. Corporate High Yield Bond Index measures the USD-denominated, high yield, fixed-rate corporate bond market. Securities are classified as high yield if the middle rating of Moody’s, Fitch and S&P is Ba1/BB+/BB+ or below. Bonds from issuers with an emerging markets country of risk, based on the indices’ EM country definition, are excluded.
The Russell 2000® Index measures the performance of the small-cap segment of the US equity universe. It includes approximately 2000 of the smallest US equity securities in the Russell 3000 Index based on a combination of market capitalization and current index membership. The Russell 2000 Index represents approximately 10% of the total market capitalization of the Russell 3000 Index. Because the Russell 2000 serves as a proxy for lower quality, small cap stocks, it provides an appropriate benchmark for RMB Special Situations.
The U.S. Dollar Index is used to measure the value of the dollar against a basket of six foreign currencies: the euro, Swiss franc, Japanese yen, Canadian dollar, British pound, and Swedish krona.
MSCI U.S. REIT Index is a free float-adjusted market capitalization weighted index that is comprised of equity Real Estate Investment Trusts (REITs). The index is based on the MSCI USA Investable Market Index (IMI), its parent index, which captures the large, mid and small cap segments of the USA market. With 150 constituents, it represents about 99% of the US REIT universe and securities are classified under the Equity REITs Industry (under the Real Estate Sector) according to the Global Industry Classification Standard (GICS®), have core real estate exposure (i.e., only selected Specialized REITs are eligible) and carry REIT tax status.
Disclaimers
Performance Disclosures
All market pricing and performance data from Bloomberg, unless otherwise cited. Asset class and sector performance are gross of fees unless otherwise indicated.
The opinions and analyses expressed in this newsletter are based on Curi Capital, LLC’s (“Curi Capital”) research and professional experience are expressed as of the date of our mailing of this newsletter. Certain information expressed represents an assessment at a specific point in time and is not intended to be a forecast or guarantee of future results, nor is it intended to speak to any future time periods. Curi Capital makes no warranty or representation, express or implied, nor does Curi Capital accept any liability, with respect to the information and data set forth herein, and Curi Capital specifically disclaims any duty to update any of the information and data contained in this newsletter. The information and data in this newsletter does not constitute legal, tax, accounting, investment or other professional advice. Returns are presented net of fees. An investment cannot be made directly in an index. The index data assumes reinvestment of all income and does not bear fees, taxes, or transaction costs. The investment strategy and types of securities held by the comparison index may be substantially different from the investment strategy and types of securities held by your account.