
Key Takeaways
- The government shutdown left markets and the Federal Reserve navigating an incomplete economic picture. Although the government has reopened, many reports remain delayed, and some will likely never be released.
- Missing economic data contributed to diverging opinions about future interest rate cuts among Federal Open Market Committee members, which fueled market volatility.
- AI-related spending is expected to contribute to over 40% of GDP growth in 2025, making it both a major source of growth as well as market concentration.
- Mega-cap technology companies remained key drivers of strong third-quarter earnings growth for U.S. large-cap stocks, a trend which is expected to continue well into 2026.
- With a clearer economic picture post government shutdown, stocks and bonds rallied, and the Fed’s near-term monetary policy strategy came into focus.
Overview
Given our complex, dynamic world, we can never really have a complete picture of the economy. That said, the government shutdown left investors with unusually incomplete information, and the past few weeks have felt like a “paint-by-numbers” exercise. Each new economic report, Federal Reserve comment, and corporate earnings call added another stroke to an ill-defined picture. U.S. large-cap stocks, as measured by the S&P 500 index, ended November essentially flat, up 0.2%. The Russell 2000 index of U.S. small-cap stocks gained 1.0% over the month. U.S. intermediate-term bonds, as proxied by the Bloomberg U.S. Aggregate Bond Index, ended November up 0.6%.
Paint-by-Numbers
The U.S. government shutdown, triggered by unresolved budget disputes, began on October 1 and ended on November 12, marking the longest government shutdown in U.S. history.1 During that period, key economic data from agencies such as the Bureau of Labor Statistics, the Bureau of Economic Analysis, and the Department of the Treasury were delayed or disrupted, leaving markets, investors, and the Federal Reserve with an incomplete view. For six weeks, private-sector indicators (including the Johnson Redbook Index, Challenger, Gray & Christmas jobs report, state-level initial jobless claims, and the University of Michigan consumer survey), alongside third-quarter earnings results, provided the only strokes of color.
Since the government reopened, economic reports have slowly trickled in, with no set schedule for those delayed due to the government shutdown. Even Bloomberg has given up on pinpointing the exact timing of economic data prints, offering only a date range (between December 2 and December 10, 12, 19, and 31) on their official economic release calendar.
Retail sales in September (released on November 25) missed estimates, rising only 0.4% month-over-month.2 Importantly, the “control group,” which is a direct input to the third-quarter GDP estimate, declined by 0.1%, recording a negative reading for the first time in five months.2 Consumer sentiment in October fell to 51, the second-lowest reading in 50 years, and the Conference Board’s survey showed the share of consumers reporting jobs as “hard to get” near its highest level since 2021.3,4 Black Friday spending was muted, rising 3% year over year.5 Adobe Analytics reported a notable 9% increase in buy-now-pay-later spending relative to 2024.6 AI-driven ecommerce traffic surged 758% year over year, generating more purchases than traditional channels such as social media, email, or organic search.6 With no third-quarter GDP print available yet, the Atlanta Fed’s GDPNowcast provides the best estimate, projecting third-quarter growth of 3.9%.7
It seems that two critical pieces of the picture will remain missing forever: the Bureau of Labor Statistics will not release an October inflation report, as data could not be collected retroactively, and the Employment Situation report (which includes the unemployment rate) for October will also never exist, though the Establishment Survey (which measures nonfarm payrolls) portion will be released.8,9 The Congressional Budget Office estimates the government shutdown will detract 1.5% from fourth-quarter GDP growth and result in $11 billion in inflation-adjusted GDP permanently lost.10
It is hard not to notice the disconnect between record-low consumer sentiment and strong GDP growth. What has been released shows a divergence in momentum: while some sectors and households are seeing gains, others are clearly falling behind. News stories and searches for “K-shaped” economic recoveries reflect this dynamic. Google search interest rose to 85 in early November, the highest since 2004 (100 indicates peak popularity for a search term).11 This dynamic was captured by the Federal Reserve Bank of San Francisco in the most recent Fed beige book, released on November 26:
“Consumers at the lower end of the income distribution continued to reduce their discretionary spending, including on full-service restaurant dining, elective health care, entertainment, and beauty and personal services… Demand from consumers at the higher end of the income distribution was resilient.”12
Without more official data to guide expectations, Federal Reserve members began to diverge on whether to cut interest rates by 0.25% at the December FOMC meeting. While Fed Chair Jerome Powell has remained publicly silent since the October 29 FOMC meeting, other committee members have been vocal, and betting markets now predict an 87% chance that at least two members will vote against an interest rate cut at the December meeting.13 Fed Governor Christopher Waller discussed Fed members’ differing opinions on November 17:
“On the group-think thing, people who are accusing us of this, get ready. You might see the least group-think you’ve seen from the FOMC in a long time.”14
Boston Fed President Susan Collins similarly noted on November 22:
“We’re in a complex period. I think having a range of views is important… If we all thought exactly the same thing, I think that would be problematic.”15
From the stock market’s perspective, not cutting rates would be a mistake. The S&P 500 declined by 5% between November 12 and November 20 while the Russell 2000 declined by 6% over the same period. Comments from Fed officials favoring a rate cut helped reverse some losses: between November 20 and November 26, the S&P 500 rose 4% while the Russell 2000 rallied 8%. On November 17, the probability of a rate cut had dropped to 42%, but spiked to 74% on Monday, November 24, after New York Fed President John Williams said:16
“I still see room for a further adjustment in the near term to the target range for the Federal funds rate to move the stance of policy closer to the range of neutral.”17
San Francisco Fed President Mary Daly shared a similar sentiment, citing concerns about a deterioration in the labor market, noting: “I don’t feel as confident we can get ahead of it.”18 On the risk of rate cuts, Daly said:
“For me, I put the risks of moving [rates down] a little bit lower than the others, and I put the risk of not moving a little bit higher than the others.18
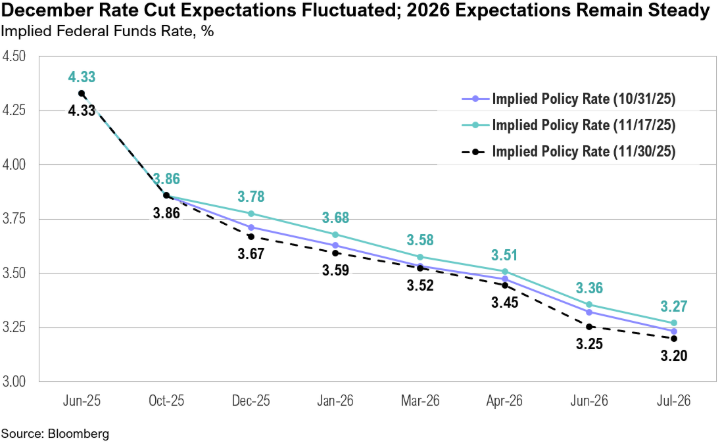
Notably, 2026 rate-cut expectations remained relatively stable. Markets are pricing in the equivalent of two quarter-point reductions next year—one of which is expected before Powell’s term ends in May.16 At the December 9 FOMC meeting, the Fed will release projections for year-end 2026 rates.
Despite the incomplete economic data, the third-quarter earnings season added some color to an otherwise blank canvas. As of the end of November, 95% of S&P 500 companies had reported results, and 83% of companies exceeded expectations.19 Earnings growth expectations for the third quarter notably improved through November, rising from 8% at the end of September to 13% by month end. Information technology (+28%) and utilities (+24%) remained key drivers of overall earnings growth.19 Looking ahead, full-year 2025 S&P 500 earnings growth expectations continue to edge higher, rising from 11% at the end of September to 12% by November’s end, and full-year 2026 expectations at 14%.19 Revenue growth for the S&P 500 is expected to rise by 8% in the third quarter, marking the highest revenue growth rate for the index since the third quarter of 2022 (when revenue grew by 11%).20 The third quarter also marked the highest net profit margin for the S&P 500 since at least 2009, at 13.1.20 The previous high for net profit margins was 13.0%, recorded in the second quarter of 2021. Earnings for the Magnificent Seven (Apple, Meta, Microsoft, Amazon, Alphabet, Tesla and Nvidia) rose 18% (versus 12% for the rest of the 493 S&P 500 companies).19

AI-related earnings growth continued to dominate market narratives. On November 18, Alphabet announced the launch of Gemini 3, which outperformed OpenAI’s ChatGPT in all major AI benchmarks (including academic and visual reasoning, scientific knowledge, coding, and mathematics, amongst others) and was trained without Nvidia chips.21,22,23 Alphabet’s share price rose 14% in the week following the release of Gemini 3. In contrast, despite reporting strong earnings on November 19, Nvidia’s share price declined by 2% over the same period.
Gemini 3 highlights the intense competition that is coming to define the AI age, particularly between tech giants like Alphabet and the OpenAI-Nvidia duo (OpenAI’s ChatGPT uses Nvidia chips). Anthropic uses a mix of chips from Google and Nvidia, and Meta (which had up until recently been using Nvidia chips) announced on November 25 that it is in talks to use Google chips to diversify away from Nvidia.24,25
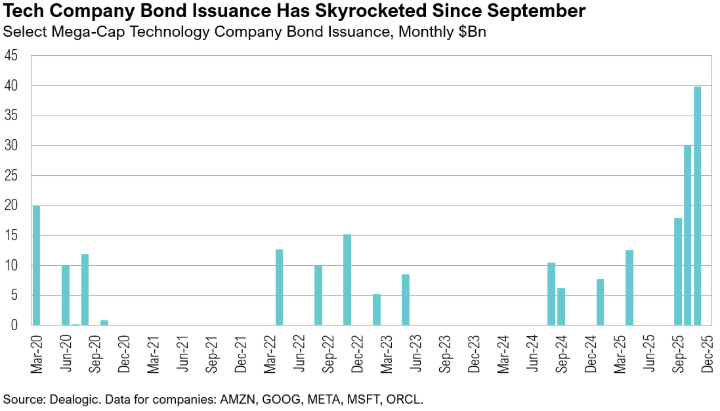
According to the Center of Public Enterprise, AI will account for over 40% of GDP growth in 2025.26 Yet the pace of AI companies’ spending remains a concern. Investors question OpenAI’s commitment to spend over $1 trillion, despite having only $13 billion in revenue and being five years away from profitability.27,28 Anthropic, the second-largest private AI company after OpenAI, does not expect to be profitable until 2028.27 Intense competition, a rise in vendor financing, and increased debt issuance (over $70 billion since September) add to these concerns.29 Oracle’s outstanding debt surpassed $100 billion in November as it continues to borrow heavily to fund AI infrastructure buildouts, making it the most indebted investment-grade mega-cap tech company.29 By the end of November, the cost of insuring Oracle’s debt against default climbed to its highest level since March 2009, rising to 1.3% per year—more than triple the cost in June when it was just 0.4%.30 Oracle’s stock price declined by 21% in November. In addition to the sparse economic data and divergent Fed views, these worries contributed to muted equity performance in November.
Markets
U.S. large-cap stocks ended November up 0.2% while international developed market stocks ended the month up 0.6%. U.S. small-cap stocks gained 1.0% over the month while developed market small-cap stocks ended November up 1.2%. Emerging market stocks declined by 2.4%.
The 10-year Treasury yield remained steady throughout November. It dropped marginally below 4% on November 27 before ticking up to end the month at 4.01%. High-yield credit spreads widened to 3% on November 24 amid market uncertainty over the Fed’s path for rate cuts and news of intensifying competition in the AI sector. However, spreads eased to end November at 2.7% as the probability of a December rate cut strengthened. (A recent low of 2.6% was recorded on September 19.) Despite the uptick, credit spreads remained contained by historical standards: the 10-year average is 4.0%.
Gold, which has gained 59% over the year, ended the month up 4%, briefly dropping below $4,000 per ounce in early November before rebounding. West Texas Intermediate (WTI) crude oil prices spent the last 10 days of November trading below $60 per barrel, ending the month at $59. WTI prices need to be at least $65 per barrel for a U.S. firm to profitably drill a new well.31 National average gas prices dropped below $3 per gallon for the first time since May 2021, ending November at $2.99 per gallon.32

Looking Forward
On December 1, the Fed ended quantitative tightening (QT). When the Fed restarted a technical quantitative easing (QE) cycle in September 2019, one justification was that reserves had fallen below what was deemed to be “ample” levels (then, $2 trillion). Reserves have again recently dropped below what is considered to be an “ample” level (now, $3 trillion). This, combined with recent comments from Chair Powell and Governor Waller, suggests the Fed may soon restart QE. At the October FOMC meeting, Powell noted:
“… Reserves is the thing that we’re managing that has to be ample. So, that’ll happen for a time, but not a tremendously long time. We don’t know exactly how long, but at a certain point, you’ll want to start—you’ll want to start reserves to start gradually growing to keep up with the size of the banking system and the size of the economy.”33
With a clearer economic picture post-government-shutdown, equity markets rallied, and the Fed’s near-term monetary policy strategy came into focus. Despite elevated equity valuations, historically tight credit spreads, continued earnings growth, and the prospect of substantially easier policy (including the likely restarting of QE), should encourage investors to patiently stay the course, albeit in diversified portfolios.
As long-term focused investors, we have said before that time in the market beats timing the market. The longer the holding period, the more consistent the results. However, entry valuations are critical: buying securities when valuations are low has, on average, generated better performance over the long-run than buying when valuations are high, and valuations are unambiguously high. This all suggests some caution, even acknowledging that market downturns and bubbles are unpredictable.
That said, there are bifurcations in the capital markets this year. Some assets have had muted performance, while others have roared ahead. As for the parts of the market that may have been left behind, we will gradually and very incrementally reallocate to asset classes and companies that have been out of favor and we believe offer the best risk-adjusted returns, acknowledging that no one knows exactly how this will play out.
Performance Disclosures
All market pricing and performance data from Bloomberg, unless otherwise cited. Asset class and sector performance are gross of fees unless otherwise indicated.
Citations
- U.S. Census Bureau: https://www.census.gov/retail/sales.html
- Reuters: https://www.reuters.com/legal/government/us-house-vote-deal-end-longest-government-shutdown-history-2025-11-12/
- Federal Reserve Bank of St. Louis: https://fred.stlouisfed.org/series/UMCSENT
- Conference Board: https://www.conference-board.org/topics/consumer-confidence/
- Salesforce: https://www.salesforce.com/retail/peak-holiday/
- Adobe Analytics: https://business.adobe.com/resources/holiday-shopping-report.html
- Federal Reserve Bank of Atlanta: https://www.atlantafed.org/cqer/research/gdpnow
- Bureau of Labor Statistics: https://www.bls.gov/news.release/empsit.nr0.htm
- Reuters: https://www.reuters.com/business/schedule-us-economic-data-delayed-by-government-shutdown-2025-11-28/
- Congressional Budget Office: https://www.cbo.gov/system/files/2025-10/61823-Shutdown.pdf
- Google Trends: https://trends.google.com/trends/explore?date=all&geo=US&q=k-shaped&hl=en
- Federal Reserve: https://www.federalreserve.gov/monetarypolicy/files/BeigeBook_20251126.pdf
- Polymarket: https://polymarket.com/event/how-many-dissent-at-the-next-fed-meeting-265?tid=1764779654580
- Reuters: https://www.reuters.com/business/finance/feds-waller-says-weak-job-market-justifies-rate-cut-december-2025-11-17/
- CNBC: https://www.cnbc.com/2025/11/22/federal-reserve-collins-interest-rates.html
- CME: https://www.cmegroup.com/markets/interest-rates/cme-fedwatch-tool.html
- Federal Reserve Bank of New York: https://www.newyorkfed.org/newsevents/speeches/2025/wil251121
- Wall Street Journal: https://www.wsj.com/economy/central-banking/feds-daly-backs-december-rate-cut-citing-vulnerable-labor-market-07a497b6
- FactSet: https://advantage.factset.com/hubfs/Website/Resources%20Section/Research%20Desk/Earnings%20Insight/EarningsInsight_112125.pdf
- FactSet: https://insight.factset.com/sp-500-reporting-highest-net-profit-margin-in-over-15-years
- Google: https://storage.googleapis.com/deepmind-media/Model-Cards/Gemini-3-Pro-Model-Card.pdf
- The Conversation: https://theconversation.com/google-is-relying-on-its-own-chips-for-its-ai-system-gemini-heres-why-thats-a-seismic-change-for-the-industry-270818
- Artificial Analysis: https://artificialanalysis.ai/leaderboards/models
- Anthropic: https://www.anthropic.com/news/expanding-our-use-of-google-cloud-tpus-and-services
- Reuters: https://www.reuters.com/business/meta-talks-spend-billions-googles-chips-information-reports-2025-11-25/
- Center of Public Enterprise: https://publicenterprise.org/wp-content/uploads/Bubble-or-Nothing.pdf
- Wall Street Journal: https://www.wsj.com/tech/ai/openai-anthropic-profitability-e9f5bcd6
- CNBC: https://www.cnbc.com/2025/11/06/sam-altman-says-openai-will-top-20-billion-annual-revenue-this-year.html
- Wall Street Journal: https://www.wsj.com/finance/investing/flood-of-ai-bonds-adds-to-pressure-on-markets-88f17995
- Bloomberg: https://www.bloomberg.com/news/articles/2025-12-02/oracle-credit-fear-gauge-hits-highest-since-2009-on-ai-bubble-fears
- Federal Reserve Bank of Dallas: https://www.dallasfed.org/research/surveys/des/2025/2501#tab-questions
- AAA: https://gasprices.aaa.com/
- Federal Reserve: https://www.federalreserve.gov/mediacenter/files/FOMCpresconf20251029.pdf
Index Definitions
The S&P 500 Index is widely regarded as the best single gauge of the United States equity market. It includes 500 leading companies in leading industries of the U.S. economy. The S&P 500 focuses on the large cap segment of the market and covers approximately 75% of U.S. equities.
The Bloomberg Barclays U.S. Aggregate Index represents securities that are SEC-registered, taxable, and dollar denominated. The index covers the U.S. investment grade fixed rate bond market, with index components for government and corporate securities, mortgage pass-through securities, and asset-backed securities. Duration is roughly 5 years.
The Bloomberg U.S. Corporate High Yield Bond Index measures the USD-denominated, high yield, fixed-rate corporate bond market. Securities are classified as high yield if the middle rating of Moody’s, Fitch and S&P is Ba1/BB+/BB+ or below. Bonds from issuers with an emerging markets country of risk, based on the indices’ EM country definition, are excluded.
The Russell 2000® Index measures the performance of the small-cap segment of the US equity universe. It includes approximately 2000 of the smallest US equity securities in the Russell 3000 Index based on a combination of market capitalization and current index membership. The Russell 2000 Index represents approximately 10% of the total market capitalization of the Russell 3000 Index. Because the Russell 2000 serves as a proxy for lower quality, small cap stocks, it provides an appropriate benchmark for RMB Special Situations.
The U.S. Dollar Index is used to measure the value of the dollar against a basket of six foreign currencies: the euro, Swiss franc, Japanese yen, Canadian dollar, British pound, and Swedish krona.
MSCI U.S. REIT Index is a free float-adjusted market capitalization weighted index that is comprised of equity Real Estate Investment Trusts (REITs). The index is based on the MSCI USA Investable Market Index (IMI), its parent index, which captures the large, mid and small cap segments of the USA market. With 150 constituents, it represents about 99% of the US REIT universe and securities are classified under the Equity REITs Industry (under the Real Estate Sector) according to the Global Industry Classification Standard (GICS®), have core real estate exposure (i.e., only selected Specialized REITs are eligible) and carry REIT tax status.
Disclaimers
*Source: MSCI.MSCI makes no express or implied warranties or representations and shall have no liability whatsoever with respect to any MSCI data contained herein. The MSCI data may not be further redistributed or used as a basis for other indexes or any securities or financial products. This report is not approved, endorsed, reviewed or produced by MSCI. None of the MSCI data is intended to constitute investment advice or a recommendation to make (or refrain from making) any kind of investment decision and may not be relied on as such.
The opinions and analyses expressed in this newsletter are based on Curi Capital, LLC’s (“Curi Capital”) research and professional experience are expressed as of the date of our mailing of this newsletter. Certain information expressed represents an assessment at a specific point in time and is not intended to be a forecast or guarantee of future results, nor is it intended to speak to any future time periods. Curi Capital makes no warranty or representation, express or implied, nor does Curi Capital accept any liability, with respect to the information and data set forth herein, and Curi Capital specifically disclaims any duty to update any of the information and data contained in this newsletter. The information and data in this newsletter does not constitute legal, tax, accounting, investment or other professional advice. Returns are presented net of fees. An investment cannot be made directly in an index. The index data assumes reinvestment of all income and does not bear fees, taxes, or transaction costs. The investment strategy and types of securities held by the comparison index may be substantially different from the investment strategy and types of securities held by your account. RMB Asset Management is a division of Curi RMB Capital.