Summary
- U.S. large-cap stocks, as proxied by the S&P 500 Index, were flat in July, declining 0.1%, while U.S. small-cap stocks declined by 3.0% over the month. U.S. intermediate-term bonds ended the month down 1.3%.
- With more than 88% of S&P 500 companies reporting, second-quarter earnings growth has reached 50.4%, the strongest since 2021, while profit margins are on track to hit a record 16.9%.
- Hyperscalers continue to raise their AI spending, but investors are increasingly rewarding companies with clear demand, growing backlogs, and a credible path to monetization.
- The Federal Reserve held rates steady, but a hawkish three-member dissent, alongside new Chair Kevin Warsh’s move away from forward guidance, has introduced policy uncertainty.
- Strong demand has reinforced the case for the AI buildout, shifting investor attention to whether today’s unprecedented spending levels can generate durable earnings growth and attractive long-term returns.
- With earnings growth still broad and bond yields more attractive, we continue to favor diversification across the AI buildout—and beyond it.
Overview
U.S. large-cap stocks, as measured by the S&P 500 Index, were essentially flat in July, declining 0.1%, while the small-cap Russell 2000 Index fell 3.0%. Both indices remain firmly positive year to date. The S&P 500 is up 10%, and the Russell 2000 is up 19% through the first seven months of 2026. U.S. intermediate-term bonds, proxied by the Bloomberg U.S. Aggregate Bond Index, declined 1.3% in July, bringing their year-to-date return to -0.7%.
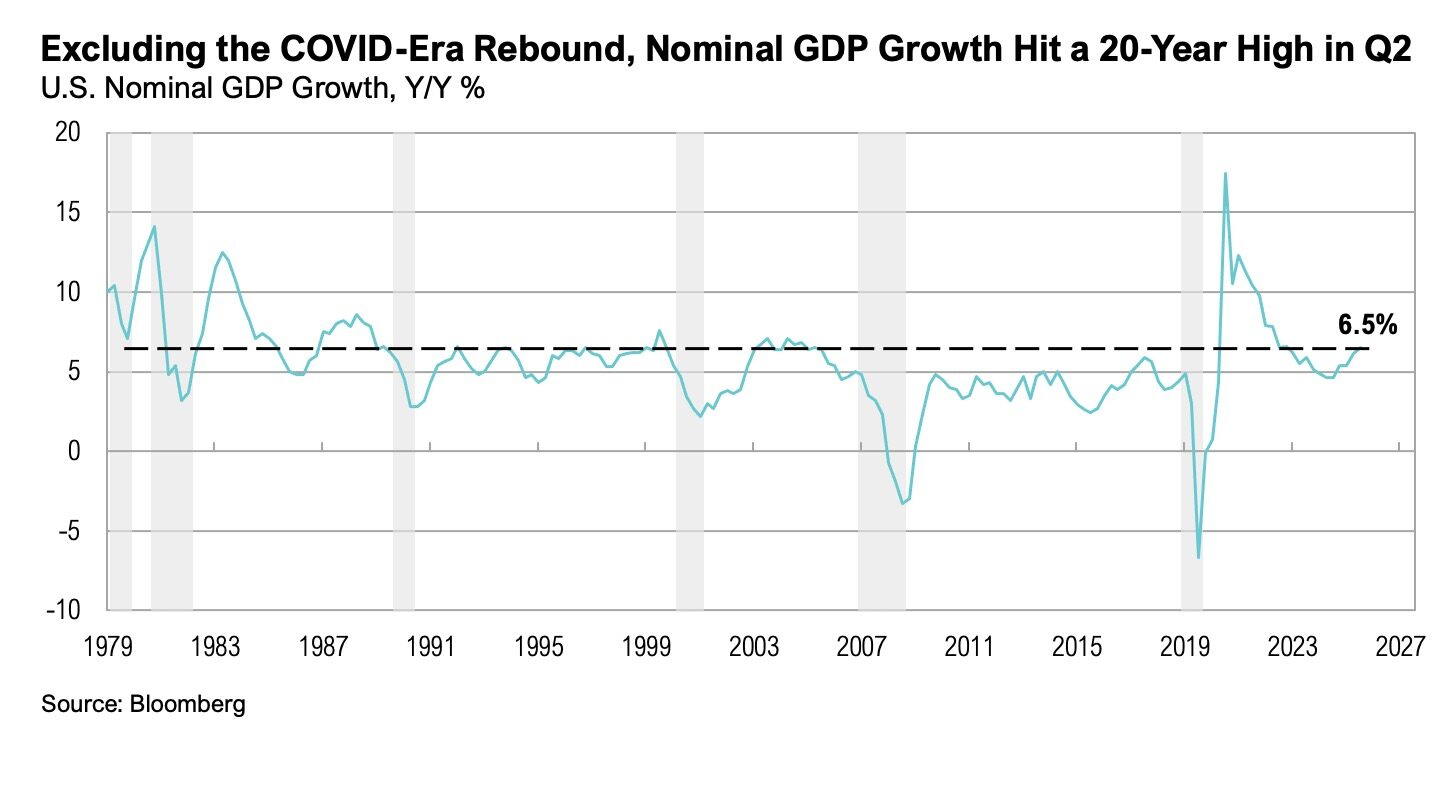
Despite a weaker-than-expected preliminary second-quarter GDP reading (1.5% annualized quarter-over-quarter versus the 2.0% consensus estimate), several indicators continue to point to a resilient U.S. economy.1 Nominal GDP growth accelerated to 6.5% year-over-year in the second quarter, reaching a 20-year high outside of the post-COVID-19 recovery period.2 Meanwhile, the ISM Manufacturing PMI rose to 55.6 in July, its highest level since May 2022.3
By August 7, more than 88% of S&P 500 companies had reported second-quarter earnings.4 As the reporting season progressed, the index’s earnings growth rate increased from 23% at the end of June to 50.4% by early August, marking the strongest quarterly earnings growth since the second quarter of 2021 (92%).4 The growth in that exceptional quarter was driven by easy year-over-year comparisons to the COVID-19-induced earnings trough in the second quarter of 2020.
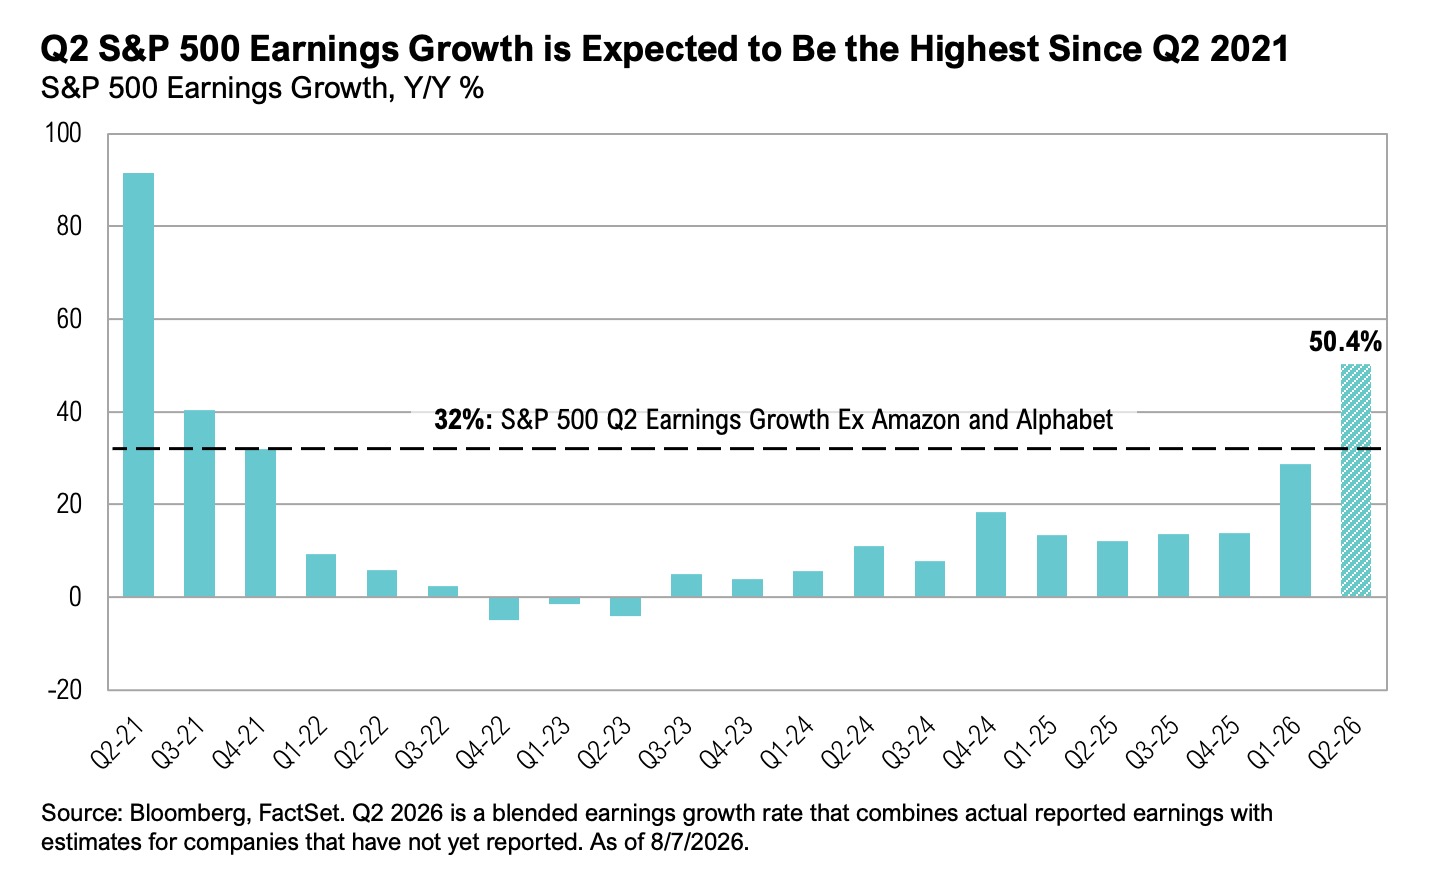
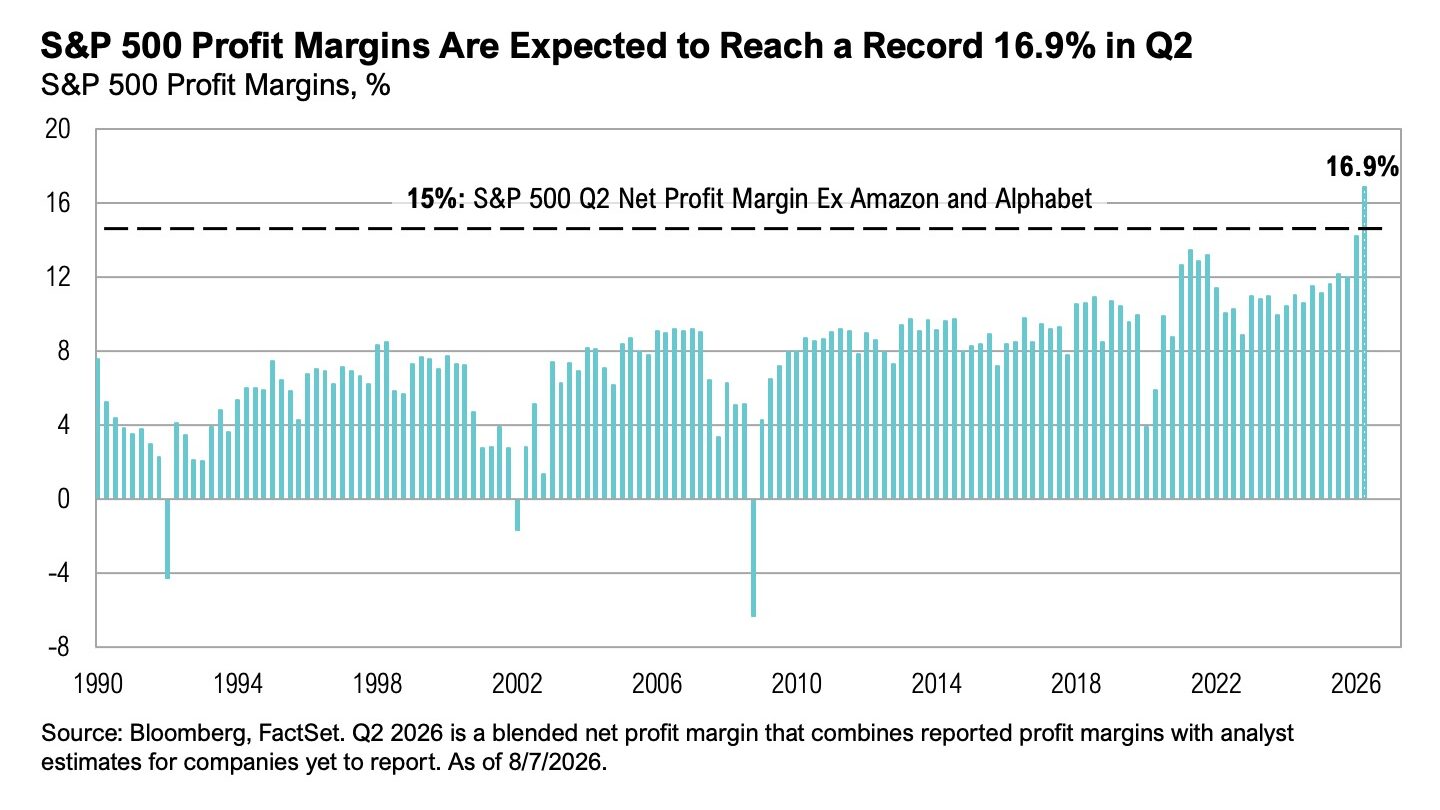
Amazon and Alphabet have been the largest contributors to earnings growth this time around, helped by unusually large valuation gains. Excluding these two companies, second-quarter S&P 500 earnings growth falls from 50.4% to a still impressive 32%.4 These two companies have also been major drivers of profitability, and S&P 500 net profit margins are projected to reach a record 16.9%. Excluding them, net profit margins are projected at 15%—still one of the highest levels since FactSet began tracking the metric in 2009.4 Looking ahead, analysts expect full-year 2026 S&P 500 earnings to grow by 30%, followed by a further 13.6% increase in 2027.4
Spender’s Dilemma
In game theory, the Prisoner’s Dilemma describes a situation where two rational participants make decisions in their own best interest, only to arrive at an outcome that is worse for both. Two suspects are questioned separately, and each must choose whether to cooperate with or betray the other. Regardless of what the other person does, betrayal is the safest individual choice. The result is that both typically betray each other, even though mutual cooperation would have produced a better outcome. The dilemma is that what is rational for the individual can be suboptimal for the group.
The artificial intelligence (AI) infrastructure race is starting to resemble a modern corporate version of this problem. The four largest hyperscalers (the technology giants building and operating the large-scale data centers that power cloud computing and AI) are Microsoft, Meta, Amazon, and Alphabet. These four companies are facing the same decision: continue accelerating AI capital spending or show greater financial discipline. Cutting investment could improve near-term cash flow and appease investors, but it risks falling behind competitors in a market where scale, compute capacity, and access to cutting-edge models increasingly determine future relevance. Conversely, raising spending invites scrutiny over returns, profitability, and the risk of overbuilding. For now, management teams appear to believe that the risk of underinvesting outweighs the risk of overspending.
That dynamic has become one of the most important debates in markets today. Capital spending across the largest hyperscalers has increased from roughly $156 billion in 2023 to approximately $443 billion in 2025 and is expected to rise further over the coming years.5
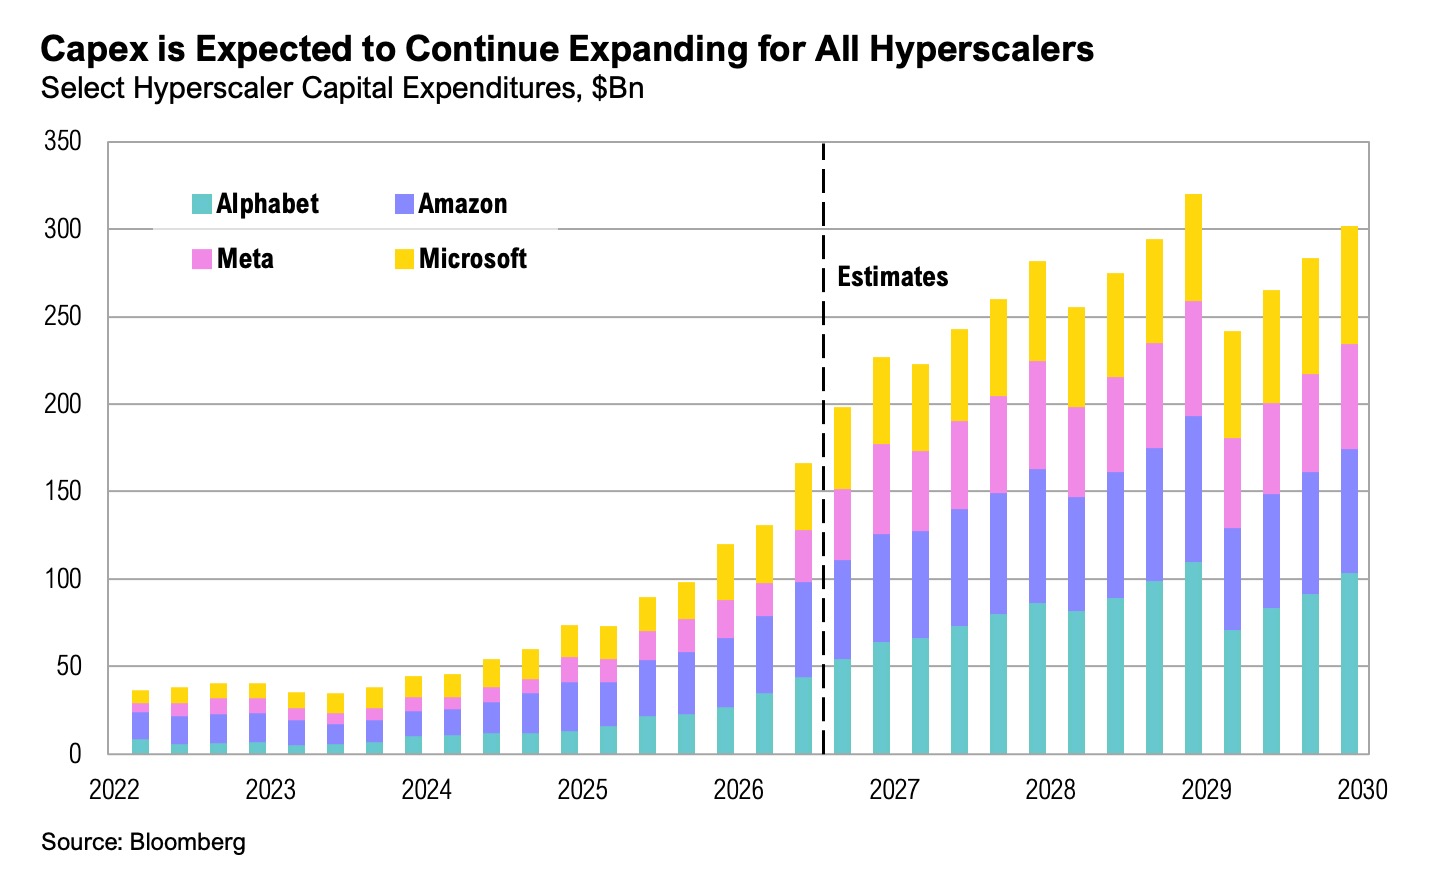
Recent second-quarter earnings reports suggest markets have become less focused on the size of AI investments and more focused on evidence that those investments can be monetized. Reactions from second-quarter earnings season suggest investors are becoming more selective rather than more skeptical.
On July 22, Alphabet reported second-quarter earnings. The stock initially rallied more than 10% after the company beat revenue and earnings expectations, but it closed down 7% after management raised its full-year capex guidance from $180-$190 billion to $195-$205 billion, including approximately $125 billion planned for the second half of the year.6 Management’s willingness to increase spending reflected growing confidence in AI demand. As CEO Sundar Pichai noted:
“We are seeing momentum across consumers and enterprises and developers and so on. So it feels like, if anything, over the past year, we’ve gotten more bullish on the opportunities ahead.”7
Google Cloud revenue reached a record $25 billion, and the backlog expanded to $514 billion. Yet investors focused on the company’s first quarter of negative free cash flow (-$5.9 billion) as AI capex rose to $45 billion.6,7 Management also declined to provide specific 2027 capex guidance, stating only that spending would “increase significantly.”7
On July 29, Microsoft reported earnings. The company reported annual cloud revenue exceeding $214 billion, Azure revenue surpassing $100 billion, and remaining performance obligations (contracted future revenue not yet recognized) rising 84% to $678 billion.8 Even excluding OpenAI, remaining performance obligations increased 25%, indicating demand remains broad-based.9 According to CFO Amy Hood:
“We remain focused on delivering efficiencies that help us bridge the gaps we see as customer demand continues to exceed supply.”9
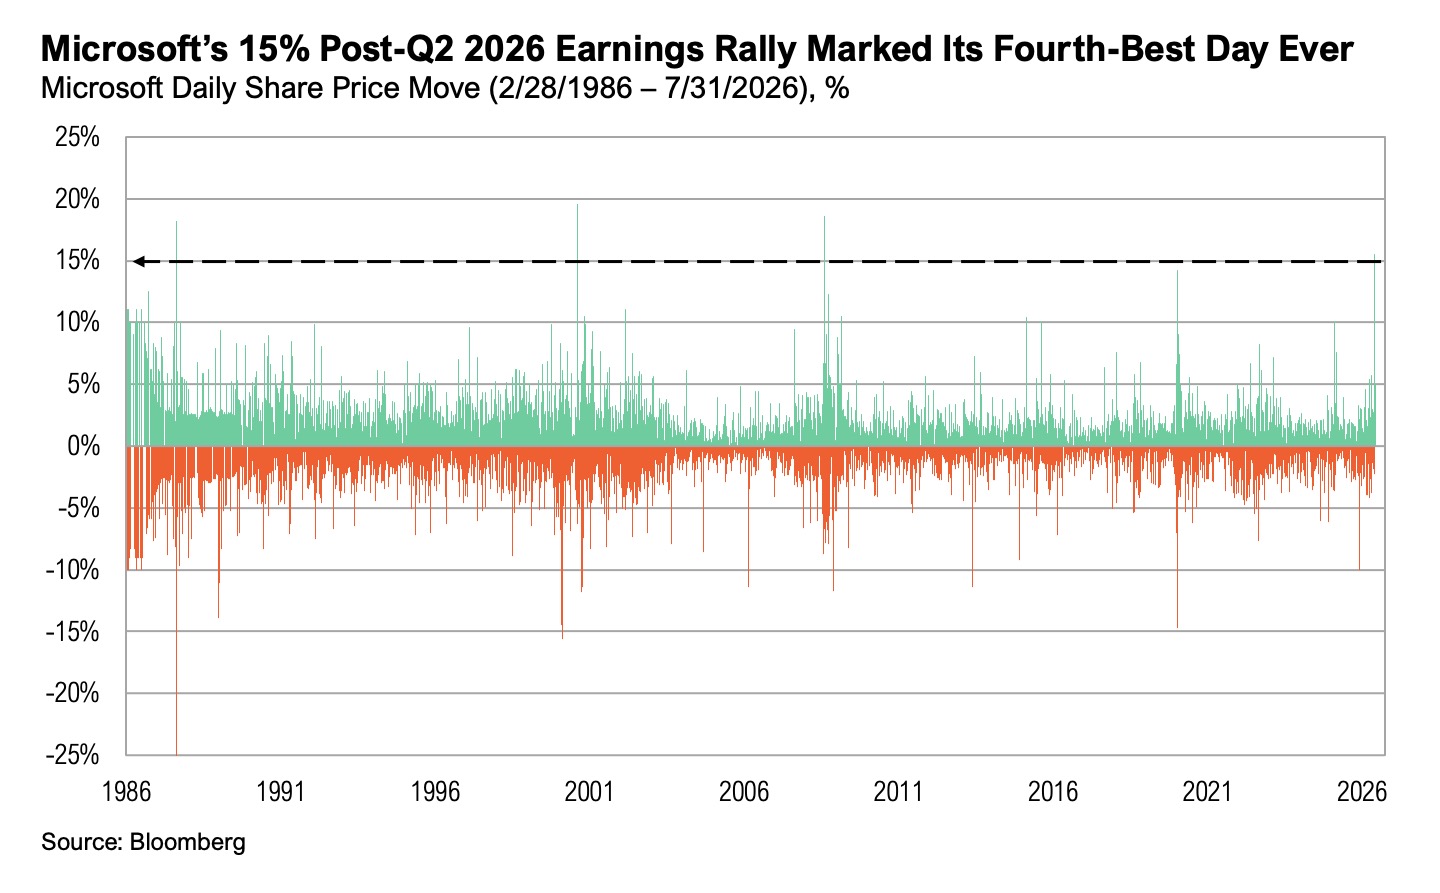
Importantly, Microsoft did not change its capex outlook, and while capex expectations remain elevated, its free cash flow is expected to remain positive through 2029.9,10 Microsoft shares gained 15% after reporting earnings, marking the fourth-largest one-day move on record for the company.
On July 30, Amazon reported earnings and proved an interesting case study. Management increased expected 2026 capital expenditure by another $20 billion to approximately $220 billion.11 At the same time, free cash flow turned negative.12 Unlike Alphabet just days earlier, investors focused primarily on demand. AWS revenue growth accelerated for a fifth consecutive quarter, reaching a $169 billion annualized run-rate.12 The backlog reached $496 billion, while management stated AWS still lacks sufficient capacity to meet customer demand and expects that constraint to persist in 2027.13,14 Per CEO Andy Jassy:
“We have so much demand right now. Apart from what we’ve talked about in 2026, a lion’s share of capacity in 2027, we’re adding a lot of capacity, is largely reserved. And we have quite a bit of capacity that’s already been reserved for 2028.”14
The company’s AI and chip businesses have each surpassed a $25 billion annual revenue run-rate and are growing at triple-digit rates.12 Despite higher capex guidance and negative free cash flow, Amazon shares rose 15% following earnings, their largest one-day gain since 2012.
Also on July 29, Meta posted strong second-quarter earnings from an operational standpoint. Revenue increased 28% year-over-year to $61 billion, advertising metrics strengthened, and Meta AI usage increased.15 Yet markets focused elsewhere. Meta increased quarterly capex to $30 billion and raised the floor on expected 2026 spending from $125 billion to $130 billion.15 At the same time, free cash flow declined roughly 90% quarter-over-quarter and is expected to turn negative in the third quarter.16 Unlike Microsoft and Amazon, Meta’s AI investments are primarily directed toward its own platforms and products, making the link between incremental AI spending and future revenue generation less direct. Meta shares declined 8% post-earnings.
In the cases of Microsoft and Amazon, investors were presented with visible evidence of strong cloud and AI infrastructure demand. Microsoft’s backlog reached $678 billion, while Amazon’s grew to $496 billion.17 AWS continues to report accelerating growth, and management maintains that capacity remains constrained despite substantial investment. Alphabet and Meta, by contrast, highlighted a growing distinction in the AI trade. Investors appear increasingly willing to fund AI spending when accompanied by clear evidence of external demand, contracted revenue, and capacity shortages. Where the path from investment to monetization is less direct, investor scrutiny has become more intense.
In fixed income markets, investors faced a different dilemma. The Federal Reserve left interest rates unchanged at its July Federal Open Market Committee (FOMC) meeting.18 However, three officials dissented in favor of a 0.25% rate hike, underscoring concerns about inflation risks, particularly after oil prices reaccelerated following the exchange of strikes between the U.S. and Iran in the final week of the month.19 West Texas Intermediate (WTI) crude briefly rose above $92 per barrel on July 23 before falling below $78 per barrel in early August after news of a renewed ceasefire in the region.20
Treasury yields moved higher following the meeting as investors interpreted the outcome as reinforcing a “higher-for-longer” interest-rate environment.21 The move may also have reflected the Fed’s reduced use of forward guidance. While investors have become accustomed to policymakers signaling the likely path of interest rates, Chair Kevin Warsh has consistently emphasized since his January nomination that the Fed would move away from providing such guidance.22,23 When asked about rising real yields during his post-FOMC press conference, Warsh suggested that the increase reflected both the Fed’s quieter approach to communication and continued economic strength, noting:
“[Economic] output is solid. Capex and productivity are strong. Labor markets, solid, steady. The bond market, the Treasury market, seems to be saying that as well. If I were to try to break down, just aggregate the Treasury market signals, I wouldn’t be able to do it perfectly, but the bond market’s saying many of those same things.”24
Markets
Domestic markets produced mixed results in July as investors faced rising geopolitical uncertainty, mixed economic data prints, a Fed that is no longer giving forward guidance, and very specific reactions to U.S. large-cap earnings results. U.S. large-cap stocks outperformed their small-cap peers. The former ended July flat, down 0.1%, and the latter ended the month down 3%. U.S. intermediate-term bonds declined by 1.3% and are now negative on a year-to-date basis.
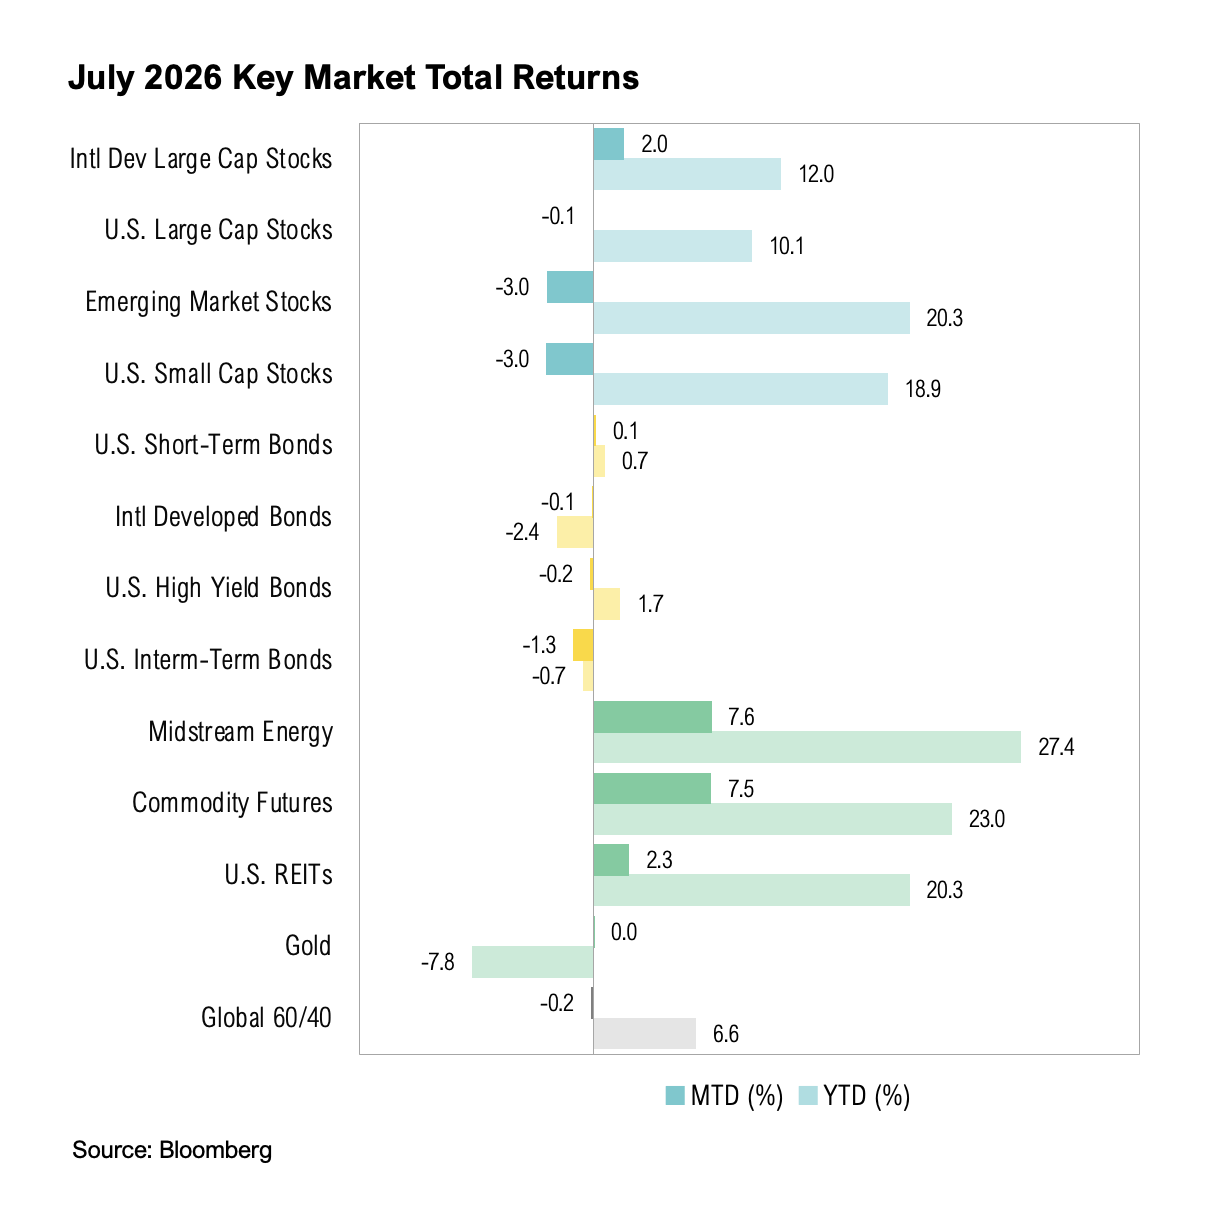
International developed large-cap stocks gained 2.0% in July, while emerging markets declined by 3.0%. At the individual country level, Colombia (+20%), Norway (+12%), and China (+9%) were among the top performers in July, while Korea (-17%) and the Netherlands (-10%) were among the countries that fared worst. Markets in both the Netherlands and South Korea sold off as semiconductor-related stocks came under pressure, reflecting the heavy concentration of each market in a small number of chip companies. In the Netherlands, ASML, a leading supplier of the lithography equipment used to manufacture semiconductors and representing 51% of the MSCI Netherlands Index, declined 18% in July.25 In South Korea, Samsung Electronics and SK Hynix, which together account for 63% of the MSCI Korea Index, fell 21% and 35%, respectively.26
Looking Forward
Second-quarter results strengthened the case that demand for cloud and AI infrastructure is real, but they did not settle the harder question: whether today’s pace of investment can earn attractive returns over time. Microsoft and Amazon continue to show strong demand and capacity constraints, while Alphabet and Meta illustrate that the path from higher spending to cash generation can be less direct. Investors still appear willing to fund the buildout, but increasingly on a company-by-company basis.
That is the spender’s dilemma. Each company has a strong incentive to keep investing because falling behind may prove more costly than overbuilding. But each additional dollar of capital spending also raises the hurdle for future profits and cash flow. Investors do not need to make a binary call today on whether the buildout ultimately proves too large or too small. The more useful question is whether demand, margins, and cash generation can keep pace with the capital being committed.
Outside AI, the broader backdrop remains reasonably supportive. Even excluding Alphabet and Amazon, S&P 500 earnings growth is tracking at 32% as of early August, with ten of eleven sectors reporting year-over-year gains.4 Higher bond yields have also improved the opportunity set in parts of fixed income. Given the range of possible outcomes, we continue to favor diversification across the beneficiaries of the AI buildout, and beyond it.
Performance Disclosures
All market pricing and performance data from Bloomberg, unless otherwise cited. Asset class and sector performance are gross of fees unless otherwise indicated.
Citations
- Bureau of Economic Analysis: https://www.bea.gov/data/gdp/gross-domestic-product
- Bloomberg data series
- ISM: https://www.ismworld.org/supply-management-news-and-reports/reports/ism-pmi-reports/pmi/july/
- FactSet: https://advantage.factset.com/hubfs/Website/Resources%20Section/Research%20Desk/Earnings%20Insight/EarningsInsight_080726.pdf
- Bloomberg data series
- Reuters: https://www.reuters.com/business/google-quarterly-cloud-revenue-growth-beats-expectations-2026-07-22/
- Alphabet: https://abc.xyz/investor/events/event-details/2026/2026-Q2-Earnings-Call-2026-GgTAq7Is0z/default.aspx
- CNBC: https://www.cnbc.com/2026/07/29/microsoft-msft-q4-earnings-report-2026.html
- Microsoft: https://view.officeapps.live.com/op/view.aspx?src=https://cdn-dynmedia-1.microsoft.com/is/content/microsoftcorp/TranscriptFY26Q4.docx
- Bloomberg data series
- CNBC: https://www.cnbc.com/2026/08/03/amazon-amzn-stock-market-cap-earnings.html
- Amazon: https://ir.aboutamazon.com/news-release/news-release-details/2026/Amazon-com-Announces-Second-Quarter-Results/
- MarketWatch: https://www.marketwatch.com/livecoverage/amazon-earnings-stock-results-guidance-q2/card/amazon-web-services-has-a-nearly-500-billion-backlog-BUGkVOcufJN5qvRWdNFO
- The Transcript: https://x.com/TheTranscript_/status/2082948689627336752
- Meta: https://investor.atmeta.com/investor-news/press-release-details/2026/Meta-Reports-Second-Quarter-2026-Results/default.aspx
- Bloomberg: https://www.bloomberg.com/news/articles/2026-07-29/meta-s-free-cash-flow-dwindles-to-lowest-in-nearly-four-years
- Yahoo Finance: https://finance.yahoo.com/technology/ai/articles/microsoft-amazon-spending-billions-ai-174738514.html
- Federal Reserve Bank of St. Louis: https://fred.stlouisfed.org/series/FEDFUNDS
- Federal Reserve: https://www.federalreserve.gov/monetarypolicy/files/monetary20260729a1.pdf
- CNBC: https://www.cnbc.com/quotes/@CL.1
- CNBC: https://www.cnbc.com/quotes/US10Y
- Wall Street Journal: https://www.wsj.com/economy/central-banking/fed-warsh-chair-communication-d2f2d226
- MarketWatch: https://www.marketwatch.com/story/warsh-warns-investors-not-to-expect-hints-at-future-fed-rate-moves-bc945c02
- Federal Reserve: https://www.federalreserve.gov/mediacenter/files/FOMCpresconf20260729.pdf
- MSCI: https://www.msci.com/documents/10199/b17551ca-7cda-472c-9e5b-f053ee998e5c
- MSCI: https://www.msci.com/documents/10199/e8fc2a89-b809-4088-a807-4b9d9ec04abc
Index Definitions
The S&P 500 Index is widely regarded as the best single gauge of the United States equity market. It includes 500 leading companies in leading industries of the U.S. economy. The S&P 500 focuses on the large cap segment of the market and covers approximately 75% of U.S. equities.
The S&P 500 Equal Weight Index (EWI) is the equal-weight version of the widely-used S&P 500. The index includes the same constituents as the capitalization weighted S&P 500, but each company in the S&P 500 EWI is allocated a fixed weight – or 0.2% of the index total at each quarterly rebalance.The S&P 500® Equal Weight Index (EWI) is the equal-weight version of the widely-used S&P 500. The index includes the same constituents as the capitalization weighted S&P 500, but each company in the S&P 500 EWI is allocated a fixed weight – or 0.2% of the index total at each quarterly rebalance.
The Bloomberg Barclays U.S. Aggregate Index represents securities that are SEC-registered, taxable, and dollar denominated. The index covers the U.S. investment grade fixed rate bond market, with index components for government and corporate securities, mortgage pass-through securities, and asset-backed securities. Duration is roughly 5 years.
The Bloomberg U.S. Corporate High Yield Bond Index measures the USD-denominated, high yield, fixed-rate corporate bond market. Securities are classified as high yield if the middle rating of Moody’s, Fitch and S&P is Ba1/BB+/BB+ or below. Bonds from issuers with an emerging markets country of risk, based on the indices’ EM country definition, are excluded.
The Russell 2000® Index measures the performance of the small-cap segment of the US equity universe. It includes approximately 2000 of the smallest US equity securities in the Russell 3000 Index based on a combination of market capitalization and current index membership. The Russell 2000 Index represents approximately 10% of the total market capitalization of the Russell 3000 Index. Because the Russell 2000 serves as a proxy for lower quality, small cap stocks, it provides an appropriate benchmark for RMB Special Situations.
The U.S. Dollar Index is used to measure the value of the dollar against a basket of six foreign currencies: the euro, Swiss franc, Japanese yen, Canadian dollar, British pound, and Swedish krona.
MSCI U.S. REIT Index is a free float-adjusted market capitalization weighted index that is comprised of equity Real Estate Investment Trusts (REITs). The index is based on the MSCI USA Investable Market Index (IMI), its parent index, which captures the large, mid and small cap segments of the USA market. With 150 constituents, it represents about 99% of the US REIT universe and securities are classified under the Equity REITs Industry (under the Real Estate Sector) according to the Global Industry Classification Standard (GICS®), have core real estate exposure (i.e., only selected Specialized REITs are eligible) and carry REIT tax status.
The MSCI China Index captures large and mid cap representation across China A shares, H shares, B shares, Red chips, P chips and foreign listings (e.g. ADRs). The index covers about 85% of this China equity universe. Currently, the index includes Large Cap A and Mid Cap A shares represented at 20% of their free float adjusted market capitalization.
The MSCI India Index is designed to measure the performance of the large and mid cap segments of the Indian market. With 165 constituents, the index covers approximately 85% of the Indian equity universe.
The MSCI Netherlands Index is designed to measure the performance of the large and mid cap segments of the Netherlands market. With 27 constituents, the index covers approximately 85% of the free float-adjusted market capitalization in Netherlands.
The MSCI Korea Index is designed to measure the performance of the large and mid cap segments of the South Korean market. With 77 constituents, the index covers about 85% of the Korean equity universe.
Disclaimers
*Source: MSCI.MSCI makes no express or implied warranties or representations and shall have no liability whatsoever with respect to any MSCI data contained herein. The MSCI data may not be further redistributed or used as a basis for other indexes or any securities or financial products. This report is not approved, endorsed, reviewed or produced by MSCI. None of the MSCI data is intended to constitute investment advice or a recommendation to make (or refrain from making) any kind of investment decision and may not be relied on as such.
The opinions and analyses expressed in this newsletter are based on Curi Capital, LLC’s (“Curi Capital”) research and professional experience are expressed as of the date of our mailing of this newsletter. Certain information expressed represents an assessment at a specific point in time and is not intended to be a forecast or guarantee of future results, nor is it intended to speak to any future time periods. Curi Capital makes no warranty or representation, express or implied, nor does Curi Capital accept any liability, with respect to the information and data set forth herein, and Curi Capital specifically disclaims any duty to update any of the information and data contained in this newsletter. The information and data in this newsletter does not constitute legal, tax, accounting, investment or other professional advice. Returns are presented net of fees. An investment cannot be made directly in an index. The index data assumes reinvestment of all income and does not bear fees, taxes, or transaction costs. The investment strategy and types of securities held by the comparison index may be substantially different from the investment strategy and types of securities held by your account.