
Key Takeaways
- U.S. large-cap stocks, as measured by the S&P 500, gained 2.2% in July while small-cap stocks rose 1.7%. U.S. intermediate-term bonds declined by 0.3%.
- The Fed’s decision to hold interest rates steady led to two dissents—the most since 1993.
- Mega-cap tech stocks drove S&P 500 earnings growth expectations higher. Artificial intelligence continues to fuel record-high tech company capital expenditures while contributing to increased job cuts in the sector.
- A global minimum 10% tariff has been introduced by the U.S., and some countries will experience higher rates. With little retaliation, the effective U.S. tariff rate has risen to 8.85%, boosting tariff revenues and creating uncertainty around future inflation.
- July brought a summer breeze of calm to markets, but policy shifts, AI disruption, and changing consumer behavior signal a more complex rest of the year.
Overview
U.S. large-cap stocks, as measured by the S&P 500 Index, gained 2.2% in July, marking the third consecutive month of gains. The Russell 2000 Index of U.S. small-cap stocks ended the month up 1.7%. In contrast, U.S. intermediate-term bonds, represented by the Bloomberg U.S. Aggregate Bond Index, finished July roughly flat, down 0.3%.
Preliminary second-quarter GDP estimates showed that the U.S. economy grew at an annualized 3.0% quarter-over-quarter—a notable improvement from the 0.5% contraction reported in the first quarter. Consumer and government spending were the main drivers of this recovery. 1 Consumer spending rose 1.4%, compared to 0.5% in the first quarter, while government spending increased by 0.4%, reversing a 0.6% decline. However, not all signals were strong: the ISM Manufacturing PMI remained in contractionary territory in July, with a reading of 48. The employment component within manufacturing dropped to its lowest level since July 2020. According to the Institute for Supply Management, “for every comment on hiring, there were two on reducing headcounts.” 2 While the ISM Services PMI showed service sector activity continuing to expand, the prices paid component rose to 69.9% in July—the highest reading since October 2022. 3 Tariffs and tariff-related costs were cited as the key reason for rising costs. 3
The Federal Reserve held interest rates steady at 4.25% – 4.50% at the July 30 Federal Open Market Committee (FOMC) meeting. The decision generated two dissents, the most since 1993. Fed Governors Christopher Waller and Michelle Bowman favored a 0.25% rate cut; both cited labor market concerns as reasons for their dissent. 4 In a statement on August 1, Waller noted:
“Data suggest that the downside risks to the labor market have increased. With underlying inflation near target and the upside risks to inflation limited, we should not wait until the labor market deteriorates before we cut the policy rate…I believe that the wait-and-see approach is overly cautious… and could lead to policy falling behind the curve.” 5
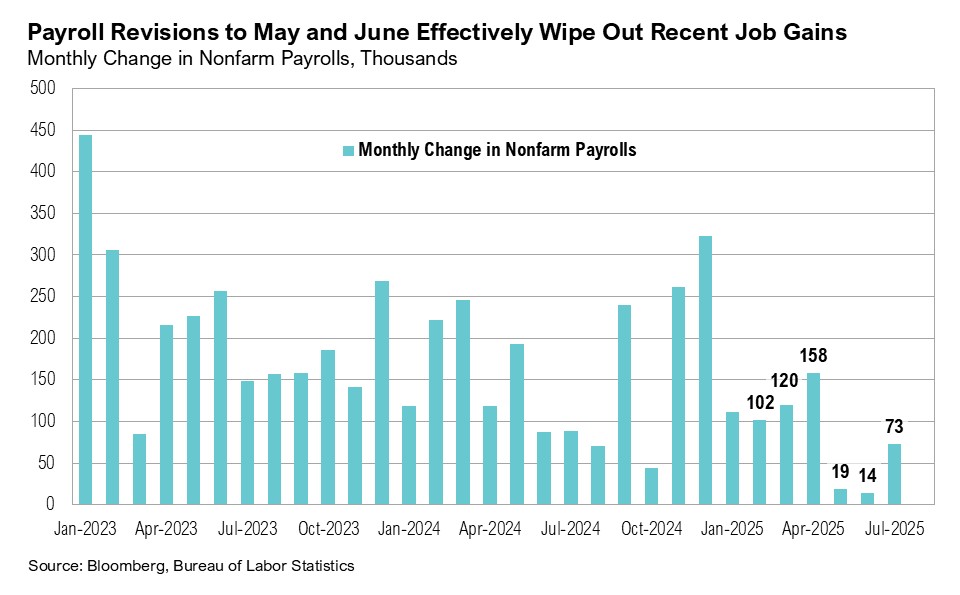
Both Waller and Bowman’s concerns were validated by the July jobs report, released on August 1. The U.S. added 73,000 jobs in the month, missing expectations by 31,000. 6 More significant, there were notable downward revisions to the prior two months: May and June payrolls were revised down by a combined 258,000 jobs—the largest two-month revisions ever outside of the 2020 pandemic. 6,7
After easing to 2.3% year-over-year in May, headline inflation edged back up to 2.7% in June. Although the inflationary impact of new tariffs has so far been more muted than expected, price increases are becoming more visible in specific categories. The price for household furnishings rose 1% month-over-month in June, the highest since January 2023. Toy prices climbed 1.4% for the second consecutive month, and major appliance prices jumped 2.3%, the highest increase since January 2024. Despite inflation pressures on some goods, other areas appear to be experiencing easing pricing pressures. For example, housing inflation (which makes up over 30% of the inflation calculation) continues to ease. In June, shelter inflation increased by 0.2%, the lowest since February 2021. 8 Despite remaining near all-time-highs, national average home prices in some major cities (Dallas, San Francisco, and Seattle) have started to decline. 9 Further, the cost of renting continues to decline, dropping nearly 2% year-over-year in May across the 50 largest metro areas. 10 Easing rent prices point to potentially slower shelter inflation and may help ease headline inflation in the coming months.
The FOMC is now on a “summer break” and will reconvene on September 17. In the interim, policymakers will receive two more inflation and employment reports, which will further inform their rate decisions. For context, when the Fed cut interest rates by 0.5% in September 2024, headline inflation was at 2.6% year-over-year, and the most recent available jobs report at the time (August 2024) showed the U.S. economy adding a modest 71,000 new jobs. Market expectations for a 0.25% interest rate cut in September skyrocketed from 38% to 88% following the July jobs report. 11
Summer Breeze
Markets spent most of July in a summery mood. On July 28, the S&P 500 set a record high, reaching 6,388 for the first time. From its April 8 low through July 31, the index gained 27%. U.S. small-cap stocks also rebounded strongly, rising 26% over the same period. Although it is still more than 6% below its all-time high, the small-cap index ended July just 0.1% in the red for the year.
This year’s “summer slowdown” (a summertime phenomenon where the stock market exhibits lower trading volumes and price volatility) was reflected in the muted movement of the CBOE Volatility Index (or VIX), which measures market expectations for volatility. Despite ongoing tariff negotiations and a flurry of executive orders (15 in total), the VIX averaged just 16.4 in July, well below the five-year average of 20.1 and the year-to-date average of 20.4. It reached a low of 14.9 on July 25. 12 For context, the lowest-ever VIX reading was 9.5, recorded on September 29, 2017. 12
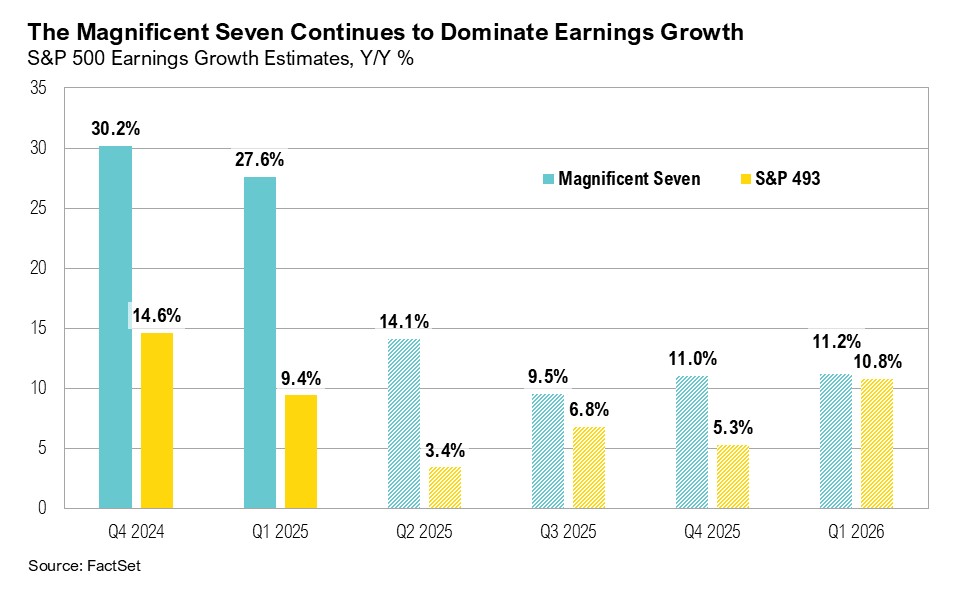
Corporate earnings helped underpin the market’s strong performance. Through the end of July, year-over-year second-quarter earnings growth expectations for the Russell 2000 Index rose to 66.4%. 13 Over 70% of small-cap companies beat second-quarter earnings expectations. 13 Full-year S&P 500 earnings growth expectations steadily rose over the month, from 9.0% to 9.9%, buoyed by better-than-expected earnings results from U.S. large-cap companies. 14 Perhaps unsurprisingly, the Magnificent Seven group of mega-cap technology companies (Alphabet, Amazon, Apple, Microsoft, Meta, Nvidia, and Tesla) continue to dominate the growth picture. For the second quarter, this group is expected to report earnings growth of 14%, compared to just 3.4% for the other 493 S&P 500 companies. 15 This trend is expected to persist throughout the rest of the year, and the Magnificent Seven stocks are projected to deliver 9.5% and 11.0% year-over-year earnings growth in the third and fourth quarters of 2025 and 11.2% in the first quarter of 2026. 15 The rest of the S&P 500 is also expected to see earnings growth improve. Forecasted year-over-year growth is expected to reach 6.8%, 5.3%, and 10.8% over the next three quarters. 15
Capital expenditure trends reflect this tech-led momentum. Mega-cap firms are continuing to ramp up investment in artificial intelligence (AI) infrastructure. Spending in 2025 is already at record highs, and executives have signaled more to come. During its second-quarter earnings call on July 23, Alphabet said it expects to spend $85 billion on capex in 2025—$10 billion more than its earlier estimate of $75 billion. 16 In their second quarter earnings call, Meta’s CFO noted:
“We currently expect another year of similarly significant capex dollar growth in 2026 as we continue aggressively pursuing opportunities to bring additional capacity online to meet the needs of our AI efforts.” 17
AI has started to drive shifts in the labor market. Job cuts in July rose to 62,075—the second-highest for a July in the past decade, behind only 2020. Technology firms led the way. According to Challenger, Gray & Christmas, AI and tariffs were the most commonly cited reasons for layoffs. Year-to-date, tech companies have announced 89,251 job cuts (up 36% year-over-year) with 10,375 of those directly attributed to artificial intelligence. 18 At the same time, the JOLTS report showed job openings in the tech sector increasing by 4.1% in the first six months of 2025, the largest six-month jump in history—reflecting the shifting priorities for tech businesses. 19

Also in July, President Trump signed 15 executive orders, including the One Big Beautiful Bill Act (OBBBA) on July 4, and two orders related to furthering U.S. artificial intelligence and data center advancements. 20 Trade policy was another major focus. As of the August 1 deadline, only a minority of countries had finalized new trade agreements. 21 The administration introduced a global minimum 10% tariff, along with targeted country-specific rates aimed at nations with large trade surpluses with the U.S.
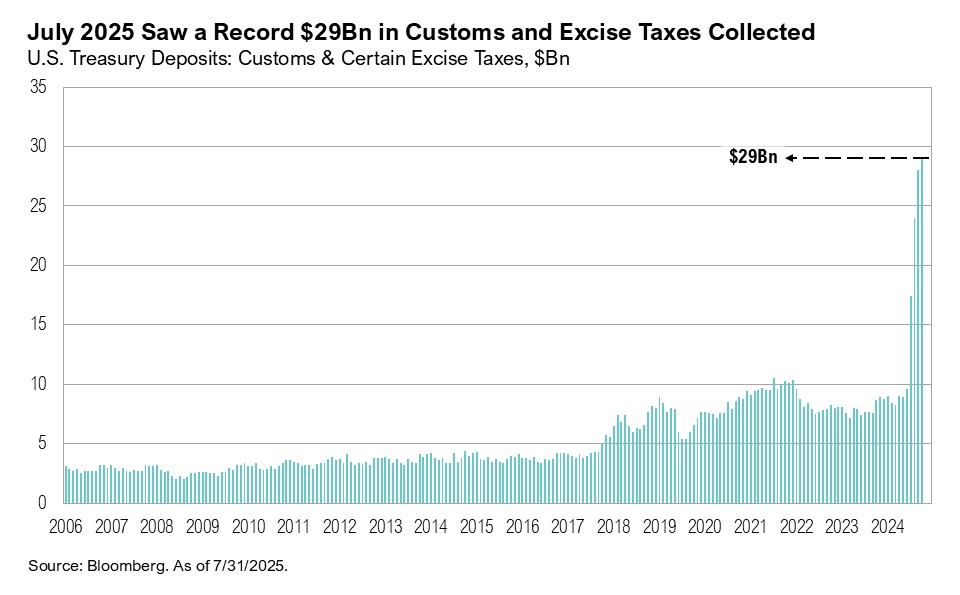
Trade agreements secured this far—with the European Union, Japan, South Korea, the United Kingdom, Vietnam, Indonesia, and the Philippines—are notably U.S.–friendly. For example, the EU has committed to investing $600 billion in the U.S. and purchasing $750 billion in U.S. energy products. 22 South Korea has said that it will invest $200 billion in semiconductors and buy $100 billion in U.S. energy. 23 Japan pledged $550 billion in investment and agreed to open its markets to American cars, rice, and agricultural goods, although these pledges are non-binding and rice commitments remain within existing quotes. 24,25 The effective U.S. tariff rate has climbed to 8.85%, and tariff revenues are growing. 26 A record $29 billion was collected in July, bringing the fiscal year-to-date total to $151 billion. 27 The additional revenue could help partially offset the $1.34 trillion federal deficit, which is expected to widen further due to the OBBBA. 28
Retail investors have been unusually active in 2025, and inflows picked up sharply after President Trump announced new tariffs in early April. Over the past three months, their share of total individual stock trading has reached the highest levels since the meme-stock peaks of 2020 and 2021. 29,30 Retail traders tend to chase high-performing, high-value names with a short-term mindset.
Outside of markets, it appears that (so far) summer vacations in 2025 have been a little cooler than in recent years. According to the Bureau of Economic Analysis, the number of people who took time off work in July dropped to its lowest level since the pandemic. 31 Bank of America reported a sharp drop in big-ticket airline spending, to its lowest since June 2021, as many consumers opted for more affordable travel. 32 Still, over 70% of survey respondents said they planned to travel over the summer, with domestic road trips topping the list. 33 That trend aligns with falling gas prices and the recent jump in auto purchases, driven by consumers seeking to front-run impending tariffs. At $3.15 for a gallon of regular gas, national average gas prices are at the lowest level since the summer of 2021. 34 And yet, air travel hasn’t vanished. As Delta Air President Glen Hauenstein noted in the company’s recent earnings call:
“We had our highest cash sales day for the month of July in a 100-year history yesterday [July 9]. So advanced bookings are doing well. I think at the beginning, when people were fearful, we saw the further out bookings going away. We see those starting to return again and hopefully, those trends continue.” 35
Markets
U.S. large-cap stocks ended July up 2.2%, outperforming their foreign peers by 3.6%, as international developed market stocks ended the month down 1.4%. U.S. small-cap stocks ended the month up 1.7% while international developed market small cap stocks ended the month flat.
Gold, which remains a top performer year-to-date (gaining 27% since January), ended the month up 0.9%, at $3,289 per ounce. Copper prices plummeted by 18% on July 30 as the U.S. implemented 50% tariffs on imports of semi-finished copper products, but not the raw material itself. 36 West Texas Intermediate (WTI) crude oil prices traded between $65 per barrel and $70 per barrel throughout the month, while national average gas prices remained at a three-year low for this time of year. U.S. crude inventories sit at 426.7 million barrels—around 6% below the five-year seasonal average. 34

Looking Forward
July brought a summer breeze of calm to markets, even as deeper undercurrents—policy shifts, AI disruption, and evolving spending patterns—remain key forces shaping markets into year end. Fiscal support for the economy remains strong, and markets now expect rate cuts at the next FOMC meeting. But any growth will not necessarily be evenly distributed. Certain areas, like healthcare, remain under political and regulatory scrutiny—evidenced by declining earnings expectations and most recently by the most-favored nation (MFN) letters sent out by the Trump administration in late July. Still others, such as infrastructure and utilities, are direct beneficiaries of secular trends.
Bond yields, which we have long viewed as the potential constraint on fiscal excesses, have remained contained, partially due to softening in the labor market. But the signal may be muddied. AI is reshaping the labor market, but it also may deliver productivity enhancements that could support corporate margins in some areas. As Microsoft CFO Amy Hood noted in their second-quarter earnings call, “We expect Q1 capital expenditures to be over $30 billion…driven by the continued strong demand signals we see.” 37 Inflation, meanwhile, continues to flow through via tariffs and targeted goods, but there are offsets, including low energy prices and a cooling in housing inflation. Although most risky assets are substantially higher than their April lows and their valuations are more elevated, we still believe investors should maintain a healthy level of risk—balanced, not excessive, and tilted to areas with fundamental and policy tailwinds.
We expect the volatility in markets to continue and remain cautious with risk assets as the current cycle plays out. Labor markets showed signs of weakening with payroll growth slowing and job openings falling. Tariff costs are starting to show up in a variety of ways but will likely start to hit monthly economic data points more clearly in the next few months. A weaker labor market and further threat of tariffs has meaningfully increased the likelihood of a rate cut in September, which could provide a modest tailwind for risk assets in the near term. The Federal Reserve will continue to play a key role and their response to economic conditions will be in focus leading up to September’s FOMC meeting.
No one can predict the future and with heightened levels of uncertainty, this is not a time to make big bets or try to time the market. We believe that portfolio level decisions on specific companies and assets are likely to have more clarity than macro views in this environment. We remain biased towards high-quality companies with strong management teams that will be able to navigate the current environment. We positioned our core bond portfolios with reduced interest rate and credit risk exposures. As always, we believe clients are best served reminding themselves of the timeless principles of patience and diversification. The key to successful investing is often remaining committed to long-term investment plans.
Citations
- Bureau of Economic Analysis: https://www.bea.gov/sites/default/files/2025-07/gdp2q25-adv.pdf
- ISM: https://www.ismworld.org/supply-management-news-and-reports/reports/ism-report-on-business/pmi/july/
- ISM: https://www.ismworld.org/supply-management-news-and-reports/reports/ism-report-on-business/services/july/
- CNBC: https://www.cnbc.com/2025/08/01/fed-governors-bowman-waller-explain-their-dissents-say-waiting-to-cut-rates-threatens-economy.html
- Federal Reserve: https://www.federalreserve.gov/newsevents/speech/waller20250801a.htm
- Bureau of Labor Statistics: https://www.bls.gov/news.release/empsit.nr0.htm
- MacroMicro: https://en.macromicro.me/charts/99068/nonfarm-payrolls-monthlychange-2months-revisions
- FRED: https://fred.stlouisfed.org/series/CUSR0000SAH1
- FRED: https://fred.stlouisfed.org/series/CSUSHPINSA#
- Realtor.com: https://www.realtor.com/research/may-2025-rent/
- CME: https://www.cmegroup.com/markets/interest-rates/cme-fedwatch-tool.html
- FRED: https://fred.stlouisfed.org/series/VIXCLS
- Lipper Alpha: https://lipperalpha.refinitiv.com/2025/07/russell-2000-earnings-dashboard-25q2-jul-31-2025/
- FactSet: https://advantage.factset.com/hubfs/Website/Resources%20Section/Research%20Desk/Earnings%20Insight/EarningsInsight_080125.pdf
- FactSet: https://insight.factset.com/are-magnificent-7-companies-still-top-contributors-to-earnings-growth-for-the-sp-500-for-q2
- Alphabet: https://abc.xyz/assets/bc/0f/01ca2b344c3b8a4efaa3783f9fdf/2025-q2-earnings-transcript.pdf
- Meta: https://s21.q4cdn.com/399680738/files/doc_financials/2025/q2/META-Q2-2025-Earnings-Call-Transcript.pdf
- Challenger: https://www.challengergray.com/blog/summer-lull-ends-july-job-cuts-spike-tech-ai-tariffs-blamed/
- FRED: https://fred.stlouisfed.org/series/JTU5100JOL
- White House: https://www.whitehouse.gov/presidential-actions/executive-orders/
- CNBC: https://www.cnbc.com/2025/07/31/trumps-aug-1-tariff-deadline-those-who-have-and-havent-signed-deal.html
- Reuters: https://www.reuters.com/business/autos-transportation/whats-trumps-trade-deal-with-europe-2025-07-27/
- CNN: https://edition.cnn.com/2025/07/30/business/us-south-korea-trade-deal
- Bloomberg: https://www.bloomberg.com/news/articles/2025-07-23/japan-s-trade-deal-a-positive-surprise-for-markets-analysts-say
- CNN: https://edition.cnn.com/2025/07/22/business/japan-trade-agreement-us
- Bloomberg data series
- Bloomberg data series
- Penn Wharton Budget Model: https://budgetmodel.wharton.upenn.edu/issues/2025/2/26/tariff-revenue-simulator
- Citadel Securities: https://www.citadelsecurities.com/news-and-insights/global-market-intelligence-gmi-august-views/
- Reuters: https://www.reuters.com/markets/us/retail-replaces-smart-money-wall-street-rocket-fuel-2025-07-29/
- Washington Post: https://www.washingtonpost.com/business/2025/08/02/trump-policies-impact-summer-travel/
- Bank of America: https://institute.bankofamerica.com/content/dam/economic-insights/consumer-checkpoint-july-2025.pdf
- Bank of America: https://institute.bankofamerica.com/content/dam/economic-insights/vacation-nation.pdf
- AAA: https://gasprices.aaa.com/pump-prices-stay-in-their-lane-as-august-begins/
- Delta Air: https://s2.q4cdn.com/181345880/files/doc_earnings/2025/q2/transcript/CORRECTED-TRANSCRIPT_-Delta-Air-Lines-Inc-DAL-US-Q2-2025-Earnings-Call.pdf
- Bloomberg: https://www.bloomberg.com/news/articles/2025-08-05/trump-s-copper-tariffs-apply-to-15-billion-of-products-so-far
- Microsoft: https://view.officeapps.live.com/op/view.aspx?src=https://cdn-dynmedia-1.microsoft.com/is/content/microsoftcorp/TranscriptFY25q4
Index Definitions
The S&P 500 Index is widely regarded as the best single gauge of the United States equity market. It includes 500 leading companies in leading industries of the U.S. economy. The S&P 500 focuses on the large cap segment of the market and covers approximately 75% of U.S. equities.
The Bloomberg Barclays U.S. Aggregate Index represents securities that are SEC-registered, taxable, and dollar denominated. The index covers the U.S. investment grade fixed rate bond market, with index components for government and corporate securities, mortgage pass-through securities, and asset-backed securities. Duration is roughly 5 years.
The Bloomberg U.S. Corporate High Yield Bond Index measures the USD-denominated, high yield, fixed-rate corporate bond market. Securities are classified as high yield if the middle rating of Moody’s, Fitch and S&P is Ba1/BB+/BB+ or below. Bonds from issuers with an emerging markets country of risk, based on the indices’ EM country definition, are excluded.
The Russell 2000® Index measures the performance of the small-cap segment of the US equity universe. It includes approximately 2000 of the smallest US equity securities in the Russell 3000 Index based on a combination of market capitalization and current index membership. The Russell 2000 Index represents approximately 10% of the total market capitalization of the Russell 3000 Index. Because the Russell 2000 serves as a proxy for lower quality, small cap stocks, it provides an appropriate benchmark for RMB Special Situations.
The U.S. Dollar Index is used to measure the value of the dollar against a basket of six foreign currencies: the euro, Swiss franc, Japanese yen, Canadian dollar, British pound, and Swedish krona.
MSCI U.S. REIT Index is a free float-adjusted market capitalization weighted index that is comprised of equity Real Estate Investment Trusts (REITs). The index is based on the MSCI USA Investable Market Index (IMI), its parent index, which captures the large, mid and small cap segments of the USA market. With 150 constituents, it represents about 99% of the US REIT universe and securities are classified under the Equity REITs Industry (under the Real Estate Sector) according to the Global Industry Classification Standard (GICS®), have core real estate exposure (i.e., only selected Specialized REITs are eligible) and carry REIT tax status.
Disclaimers
Performance Disclosures
All market pricing and performance data from Bloomberg, unless otherwise cited. Asset class and sector performance are gross of fees unless otherwise indicated.
The opinions and analyses expressed in this newsletter are based on Curi Capital, LLC’s (“Curi Capital”) research and professional experience are expressed as of the date of our mailing of this newsletter. Certain information expressed represents an assessment at a specific point in time and is not intended to be a forecast or guarantee of future results, nor is it intended to speak to any future time periods. Curi Capital makes no warranty or representation, express or implied, nor does Curi Capital accept any liability, with respect to the information and data set forth herein, and Curi Capital specifically disclaims any duty to update any of the information and data contained in this newsletter. The information and data in this newsletter does not constitute legal, tax, accounting, investment or other professional advice. Returns are presented net of fees. An investment cannot be made directly in an index. The index data assumes reinvestment of all income and does not bear fees, taxes, or transaction costs. The investment strategy and types of securities held by the comparison index may be substantially different from the investment strategy and types of securities held by your account.