
Key Takeaways
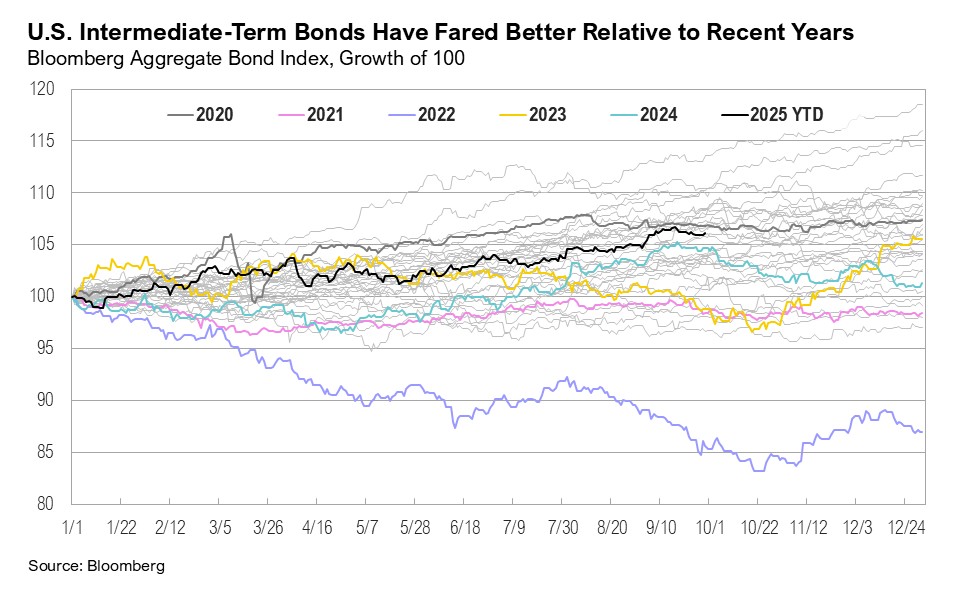
- U.S. large-cap stocks rose 8% in the third quarter while small caps gained 12%, reaching their highest levels since November 2021. U.S. intermediate-term bonds ended the quarter up 2%.
- Since ChatGPT’s launch, mega-cap tech companies have more than doubled their AI-related capital expenditures, and hyperscalers are expected to spend $340 billion on AI in 2025.
- On September 17, with inflation floating above its official 2% target, the Federal Reserve cut interest rates by 0.25%, citing labor market concerns and a slowdown in economic activity.
- The Fed’s dual mandate—to balance price stability with maximum employment—now seems suspended somewhere between caution, cutting rates at the first sign of labor softening, and complacency, easing policy while inflation remains above target.
- The Fed’s decisions come while the market appears increasingly bubble-like, with exciting developments in AI, among other areas, but growing signs of excess.
Overview
Markets performed well over the third quarter. Every major asset class ended September in positive territory year to date. U.S. small-cap stocks led the way (gaining 12%), pushing the Russell 2000 small-cap index into positive territory for the first time this year and to its highest level since November 2021. U.S. large-cap stocks, as proxied by the S&P 500, brought the index’s third-quarter gains to 8% and its year-to-date gains to 15%, also hitting a new record high. U.S. intermediate-term bonds gained 2% in the third quarter and are up 6% year-to-date, with the Bloomberg U.S. Aggregate Bond Index seeing its strongest returns since 2020.
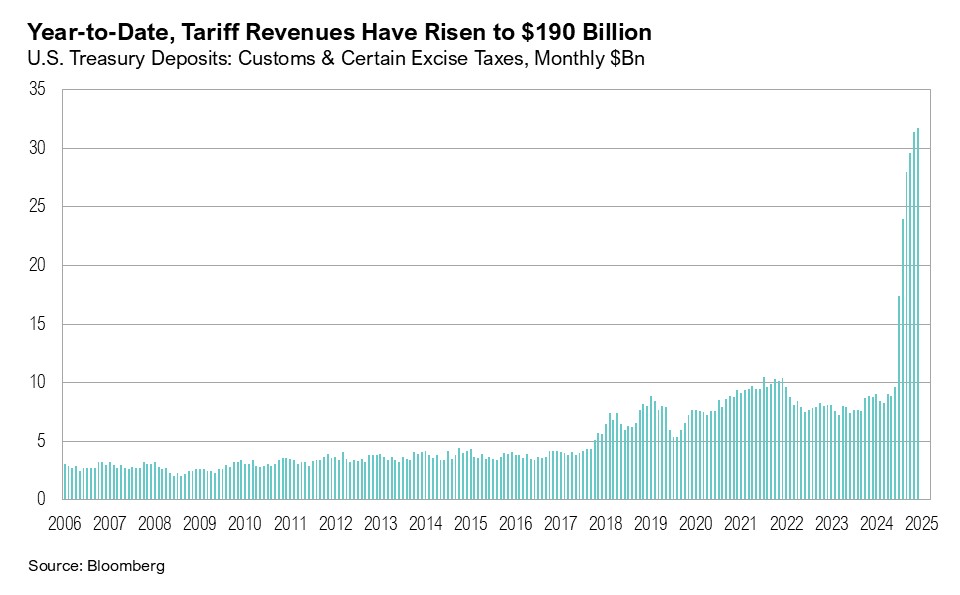
At the start of the quarter, the One Big Beautiful Bill Act (OBBBA) was signed into law. The OBBBA makes many of the provisions from the 2017 Tax Cuts and Jobs Act permanent while introducing new tax deductions, changing energy incentives, and reforming major social programs and benefit rules. 1 The Congressional Budget Office estimates the bill will add $3.3 trillion to the federal deficit over the next decade. 2 Reducing the fiscal debt burden initially appeared to be a key goal of the Trump administration, which asserted that the profits from “Liberation Day” tariffs would offset some of the deficit increase. Year to date, the U.S. government has collected $190 billion in tariff revenue. 3 For context, tariff revenue in the first nine months of 2024 amounted to $73 billion. However, through the end of August, the 2025 fiscal deficit grew to $1.97 trillion, the largest non-crisis or non-pandemic deficit on record. 4
According to final second-quarter gross domestic product (GDP) estimates, annualized quarter-over-quarter growth rebounded from -0.6% in the first quarter to 3.8% in the second quarter. 5 Strong consumer spending was the primary driver, contributing 2.5% to overall GDP, and personal spending rose 0.6% month-over-month in August, the highest level since March. 5,6 Retail sales also maintained positive momentum, rising 0.6% month-over-month in August, remaining above its 10-year average of 0.4%. 7 Looking ahead, the Atlanta Fed’s GDPNow model currently estimates third-quarter GDP to grow at a 3.8% rate, annualized quarter-over-quarter. 8
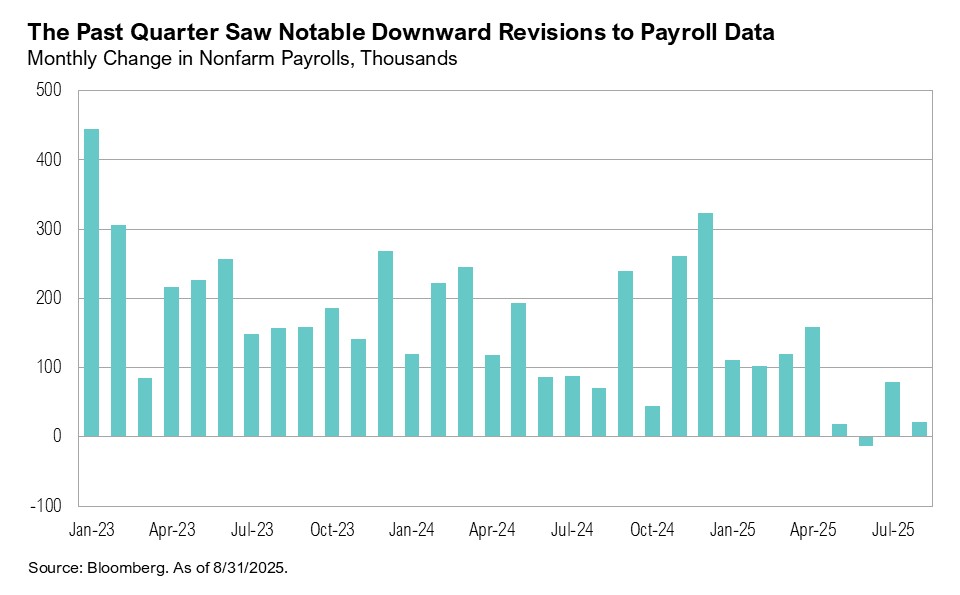
Payroll data was revised considerably during the third quarter. According to the July employment report, non-farm payrolls rose by only 73,000 jobs, missing expectations by 32,000. 9 In addition, May and June payrolls were revised down by a combined 258,000, the largest downward revisions for these months outside of the pandemic. 10 The August report was weaker still, showing only 22,000 new jobs created. It also included a further downward revision to June, now showing payrolls declining by 13,000, the first monthly drop in employment since 2020. 10 The unemployment rate ticked up to 4.3% in August, the highest level since September 2017 outside of the pandemic period.
On September 9, the Bureau of Labor Statistics released its annual benchmark revisions, showing a net downward adjustment of 911,000 jobs for the twelve months ending March 2025, the largest on record. While some of this may reflect weakening survey response rates (which have fallen from 64% in 2015 to 43% in 2025), the broader trend suggests the labor market is cooling. 11 The August Job Openings and Labor Turnover Survey (JOLTS) showed little movement in job openings, hires, or layoffs (7.2 million, 5.1 million, and 1.7 million, respectively), indicating that activity may have entered what Federal Reserve Chairman Jerome Powell described as a “low-firing, low-hiring” equilibrium. 12,13
On September 17, the Federal Reserve lowered interest rates by 0.25%, citing labor market concerns and slowing economic activity—focusing especially on the recent revisions to labor market data. During the Federal Open Market Committee (FOMC) press conference, Fed Chair Jerome Powell said:
“We were looking at 150,000 jobs a month at the time of the last meeting, and now we see the revisions and the new numbers… I don’t want to put too much emphasis on payroll job creation, but it’s just one of the things that suggests that the labor market is really cooling off. And that tells you that it’s time to take that into account in our policy.” 13
The rate cut marked a delicate turning point. With inflation still floating above the Fed’s 2% target and growth holding steady, policymakers now face a familiar tension between supporting employment and restraining price pressures. Economic projections released alongside the September rate decision indicate the Fed expects to lower rates by 0.5% before year end, implying one cut at each of the remaining 2025 FOMC meetings. 14
Bubble Trouble
What’s in a bubble? Air, mostly (nothing of tangible substance). This allows the bubble to float unpredictably until it inevitably pops. In the case of a financial bubble, asset prices rise far above their fundamental value, typically fueled by speculation and widespread participation from retail and institutional investors. History is filled with examples.
Railway mania, a 19th-century bubble, illustrates how technological revolution breeds speculative excess. In the 1840s, railways were the cutting-edge technology of the Industrial Revolution, promising faster travel, lower transportation costs, and rapid economic growth. Hundreds of railways and thousands of miles of lines were approved, but many were speculative or poorly planned, built in places where little commerce existed. Capital called in by borrowers soon exceeded what investors could repay. Consequently, credit tightened, demand collapsed, and by 1847, the bubble burst. 15 Nevertheless, it left behind hundreds of miles of railway lines still in use today.
Driven by excitement over the internet’s potential, investors in the late 1990s poured money into tech startups that generated little revenue but alluringly promised blockbuster results. 16 Equity prices, and valuations, peaked in early 2000 before collapsing. It is easy to forget how bubbly things got. For example, in May 1999, eToys, an online toy retailer, went public. Its stock soared 280%—to an $8 billion valuation—on its first day of trading, even though the company’s quarterly revenue was just $30 million and its losses were mounting. The company burned through cash as it attempted to compete with Amazon and Toys “R” Us, and it went bankrupt in February 2001 after demand collapsed and funding dried up. 17 CMGI, an internet investment company, backed dozens of startups. Between 1998 and early 2000, its share price skyrocketed more than 1,000%, briefly valuing the company above $50 billion, despite its limited operating income. When the tech tide turned, CMGI’s portfolio imploded, and its stock fell more than 99%. 18 Global Crossing was a telecom infrastructure company founded in 1997 that built undersea fiber-optic cables to power the “information superhighway.” Backed by cheap credit and investor euphoria about future internet traffic, its valuation soared past $40 billion by 2000—even though it had never posted a profit. 19 Burdened with debt and over-expansion, Global Crossing filed for bankruptcy in 2002.
Notwithstanding the excesses, the dot-com bubble left behind revolutionary technologies, like the internet itself. In the lead up to 2008, cheap credit, lax lending standards, and mortgage securitization drove U.S. home prices to dizzying heights. When borrowers defaulted and mortgage-backed securities unraveled, the bubble burst and triggered the Global Financial Crisis.
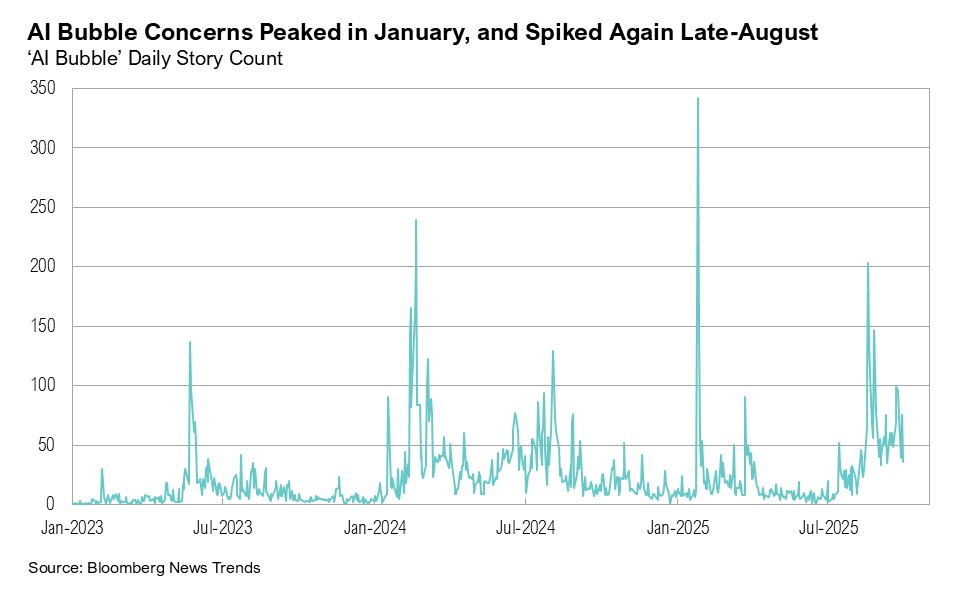
Today, debate is growing over whether the excitement surrounding artificial intelligence (AI) is creating a new bubble. Google search trends for “AI bubble” peaked in mid-August before dropping sharply. 20 Similarly, Bloomberg’s News Trends (which tracks all stories and sources published across the Bloomberg terminal) showed bubble concerns peaking shortly after Chinese tech startup DeepSeek launched its AI model in January. 21 But per Deutsche Bank Research Institute’s executive director Adrian Cox:
“While there may be a bubble, the moment everyone spots it may be the moment it is least likely to burst.” 22
At the same time, Sam Altman, CEO of OpenAI (creator of ChatGPT), said recently:
“Are we in a phase where investors as a whole are overexcited about AI? My opinion is yes. Is AI the most important thing to happen in a very long time? My opinion is also yes.” 23
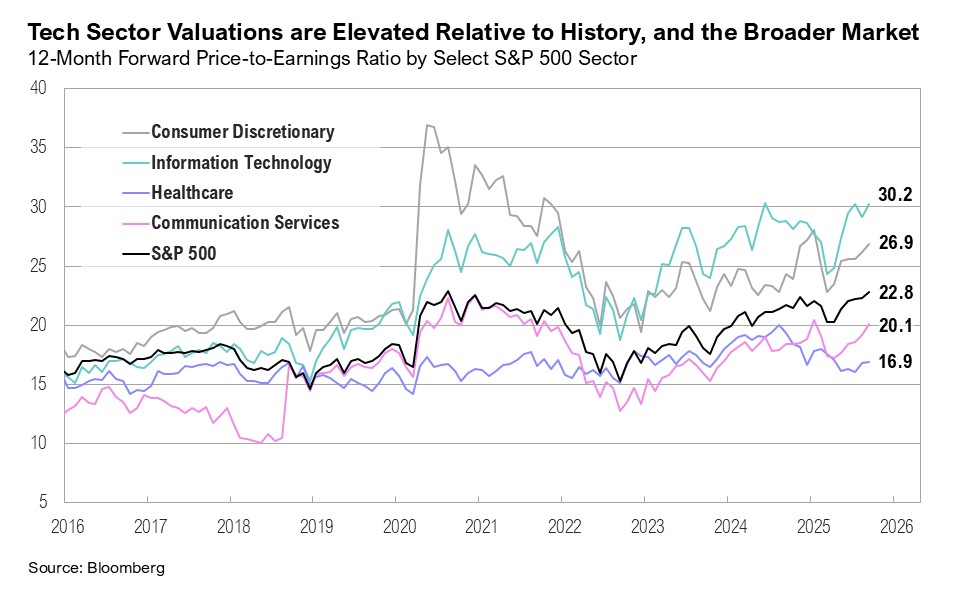
The information technology sector led performance in the S&P 500, gaining 13% in the third quarter. The Magnificent Seven (Apple, Alphabet, Amazon, Meta, Microsoft, Nvidia, and Tesla) rose 19% over the third quarter and are up 20% for the year. 24 These companies remain the key drivers behind overall market performance: the top ten S&P 500 holdings now make up a record 39% of the index, far surpassing the 1999 peak of 25% and the post-pandemic high of 30%.
Elevated valuations have not slowed the market’s recent strong performance. The tech sector’s 12-month forward price-to-earnings (P/E) ratio is 30x while its price-to-sales ratio stands at 10x—over 40% higher than at the tech bubble peak. Broader market valuations are also stretched: the S&P 500’s 12-month forward P/E ended September at 23x. (For context, the dot-com peak was 24x.)
Looking ahead, the tech sector remains a key driver of S&P 500 earnings growth estimates. For 2025, tech earnings are expected to grow by 21% year-over-year and 21% in 2026. 25 Revenue growth estimates for the sector remain robust. According to FactSet, tech sector revenues are expected to rise by 14% year-over-year in 2025 and 13% in 2026. The broader S&P 500 is expected to see earnings growth of 11% in 2025, and 14% in 2026. 25
Advanced AI models are expensive to build and run, and they require specialized chips, energy-hungry data centers, and large engineering teams. Many AI applications remain experimental, and their paths to profitability are still uncertain. Capital expenditures (capex) have been a defining theme for AI hyperscalers (the largest cloud and infrastructure providers that build, train, and deploy AI models) this year. Since the launch of OpenAI’s ChatGPT large language model in November 2022, mega-cap tech firms have more than doubled annual capex, pouring hundreds of billions of dollars into data centers and other AI-related infrastructure. 26,27
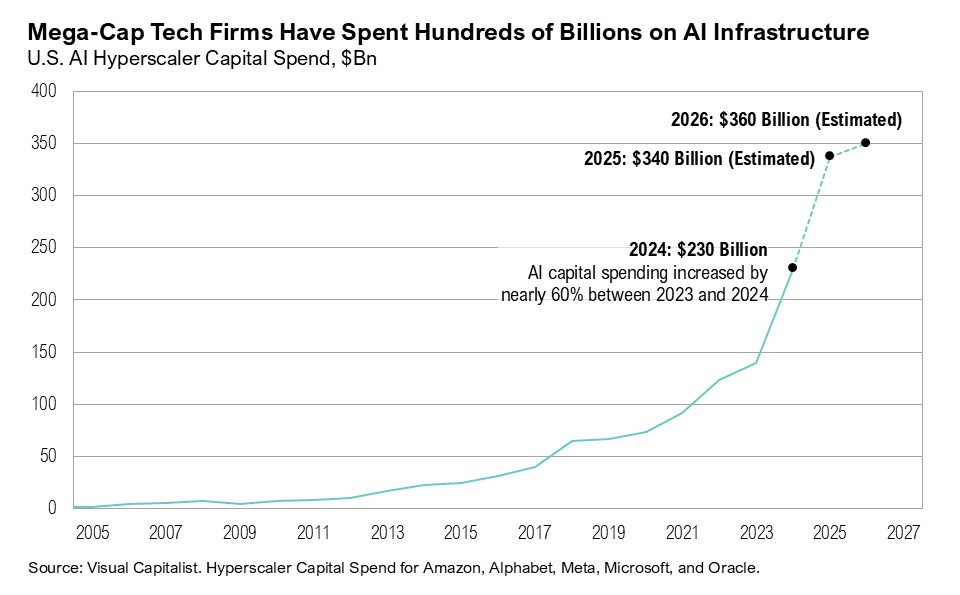
Data centers are now viewed as AI’s foundational utility and key to the advancement and development of AI models, much like railways or telecom networks from earlier eras. Hyperscalers (specifically Meta, Amazon, Alphabet, Microsoft, and Oracle) will reportedly spend about $340 billion on data center and AI infrastructure in 2025. 26,27 This equates to nearly 1% of U.S. GDP. Morgan Stanley expects $3 trillion in AI infrastructure investment by 2029. 27 Meta CEO Mark Zuckerberg highlighted the readiness of mega-cap tech firms to keep investing in AI during an interview, commenting on AI superintelligence spending:
“If we end up misspending a couple hundred billion dollars, that’s going to be very unfortunate, obviously. But I would say the risk is higher on the other side.” 28
In the same interview, he also noted:
“There’s definitely a possibility, at least empirically, based on past large infrastructure buildouts and how they led to bubbles, that something like that would happen here.” 28
The boom is not limited to public markets. OpenAI, the creator of ChatGPT and one of the world’s top AI labs was recently valued at $500 billion, topping SpaceX as the largest U.S. private company. 29 OpenAI has been signing deals valued at hundreds of billions of dollars with major infrastructure partners. On September 22, Nvidia announced a strategic partnership with OpenAI to deploy at least ten gigawatts of Nvidia AI systems across OpenAI’s data centers, backed by a $100 billion investment largely earmarked for more Nvidia chips.30 Nvidia noted that:
“OpenAI will channel part of this investment back into Nvidia hardware purchases, effectively creating a cycle of funding and chip demand.” 30
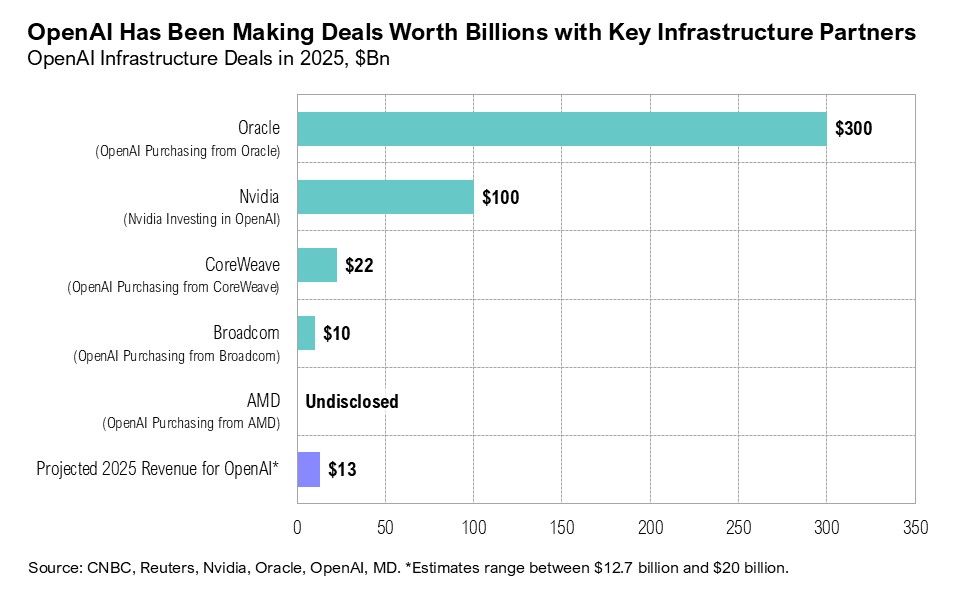
OpenAI maintains that its rapid dealmaking and scaling are central to driving future AI breakthroughs. Yet skepticism is mounting, not just over the sheer size of the deals, but over OpenAI’s reliance on a tightly interconnected web of infrastructure partners. Nvidia’s investment, for instance, gives the company an equity stake in OpenAI while simultaneously generating revenue for Nvidia. Such arrangements raise investors’ concerns about whether the momentum is sustainable. In early October, OpenAI also announced a “strategic partnership” with AI chip manufacturer AMD, one of Nvidia’s largest competitors. 31 OpenAI is set to deploy six gigawatts of AMD’s specialized chips over multiple years and is likely to also take a 10% equity stake in AMD. 31,32
A similar vendor-financing feedback loop occurred late in the dot-com boom. For example, Cisco extended massive loans and leases to telecom startups and other companies, many of them in precarious financial positions. This vendor financing let those firms buy Cisco networking equipment, and Cisco recorded the transactions as sales—even before the financed customers began repaying. 33,34 The result was a circular flow of funds: Cisco provided credit, which translated into equipment sales and fueled revenue growth despite the underlying credit risk. When many of these startups collapsed, the feedback loop unraveled, exposing the vulnerabilities in Cisco’s model and generating significant losses for the company. 33,34
Markets
In both U.S. and international markets, small-cap equities outperformed their large-cap counterparts over the quarter. U.S. small caps rose 12%, compared with an 8% gain for U.S. large-cap stocks. Similarly, international developed market small-cap stocks advanced 6%, outpacing large caps, which gained 5%. Emerging and frontier markets finished the third quarter up 11%. Strong small-cap performance propelled the Russell 2000 into positive territory for the first time this year, and the index ended the quarter up 10.4% year-to-date.
U.S. intermediate-term bonds gained 2% during the quarter. The 10-year U.S. Treasury yield fell to 4.0% in mid-September (the lowest level since April) following the release of the August inflation report and an unusual spike in jobless claims driven by flooding in Texas and seasonal data adjustments around the holiday-shortened week. By the end of September, the 10-year yield had risen slightly to 4.2%. The spread between the 10-year and 2-year Treasury yields remained positive throughout the quarter, finishing at 0.6%. Credit spreads remained tight relative to historical averages, closing the quarter at 2.7%.
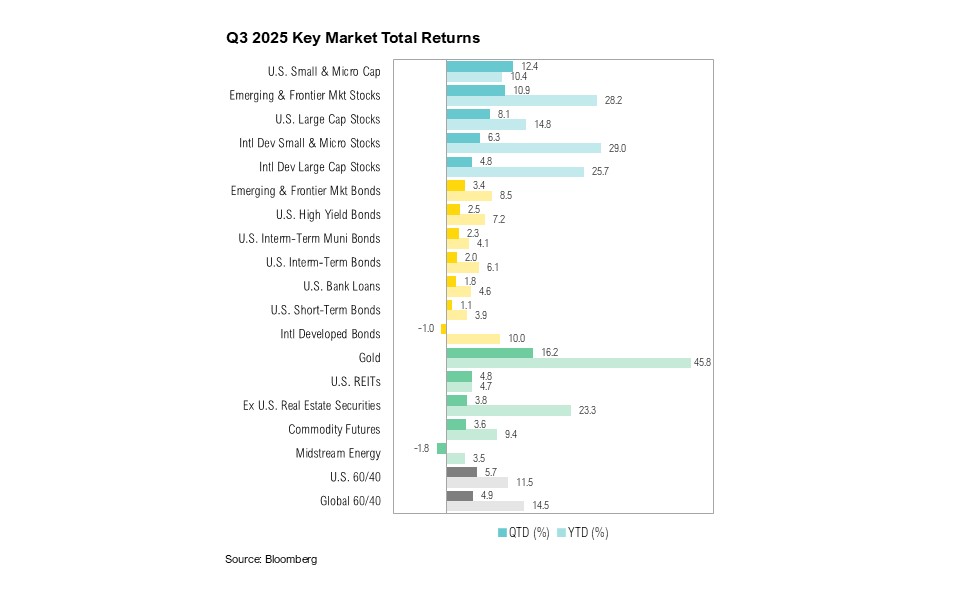
Gold, which rose 16% over the quarter, reached a record high of $3,866 on September 30, following news of an imminent U.S. government shutdown that took effect on October 1, triggered by unresolved budget disputes. West Texas Intermediate (WTI) crude oil prices fell nearly 5% over the quarter, slipping from $65 per barrel to $62 per barrel by the end of September.
Looking Forward
The Fed’s dual mandate—to balance price stability with maximum employment—now seems suspended somewhere between caution and complacency: caution when it comes to cutting rates amid relatively modest signs of labor softening, and complacency when easing policy while inflation remains stubbornly above target. This tension comes at a time when recent market exuberance feels on the verge of irrationality, forcing investors to balance complacent equity allocations with stretched valuations. Historically, time in the market beats timing the market. The longer the holding period, the more consistent the results. However, entry valuations are critical: buying securities when valuations are low has, on average, generated better performance over the long-run than buying when valuations are high, and valuations are unambiguously high. This all suggests some caution, even acknowledging that bubbles are unpredictable.
That said, there are segments of the capital markets that have been ignored, even as others have roared ahead this year. If an AI bubble does burst, we believe the greatest cost would fall to those who are heavily concentrated in AI-related technology. Yet, like the dot-com bubble, the economic and investment fallout would likely remain relatively contained, unlike an event such as the Global Financial Crisis. These possible dislocations could create attractive prices that would give investors compelling entry points into high-quality companies that remain essential drivers of innovation. As for the parts of the market that may have been left behind, we will gradually and very incrementally reallocate to asset classes and companies that have been out of favor and we believe offer the best risk-adjusted returns, acknowledging that no one knows exactly how this will play out.
Citations
- Wall Street Journal: https://www.wsj.com/politics/policy/trump-signs-big-beautiful-bill-into-law-302edba6
- CBO: https://www.cbo.gov/publication/61570
- Bloomberg series
- Bureau of the Fiscal Service: https://www.fiscal.treasury.gov/files/reports-statements/mts/mts0825.pdf
- BEA: https://www.bea.gov/data/gdp/gross-domestic-product
- Reuters: https://www.reuters.com/world/us/us-consumer-spending-increases-solidly-august-2025-09-26/
- Census Bureau: https://www.census.gov/retail/sales.html
- Atlanta Fed: https://www.atlantafed.org/cqer/research/gdpnow
- CNBC: https://www.cnbc.com/2025/09/09/jobs-report-revisions-september-2025-.html
- Bureau of Labor Statistics: https://www.bls.gov/news.release/empsit.nr0.htm
- Bureau of Labor Statistics: https://www.bls.gov/news.release/prebmk.nr0.htm
- Bureau of Labor Statistics: https://www.bls.gov/news.release/jolts.nr0.htm
- Federal Reserve: https://www.federalreserve.gov/mediacenter/files/FOMCpresconf20250917.pdf
- Federal Reserve: https://www.federalreserve.gov/monetarypolicy/files/fomcprojtabl20250917.pdf
- Liberty Street Economics: https://libertystreeteconomics.newyorkfed.org/2015/06/crisis-chronicles-railway-mania-the-hungry-forties-and-the-commercial-crisis-of-1847/
- Exponential View: https://www.exponentialview.co/p/is-ai-a-bubble
- Reuters: https://www.reuters.com/article/business/goldman-sachs-finally-ends-litigation-over-1999-etoys-ipo-idUSBRE98I0VL/
- Investing.com: https://www.investing.com/analysis/remember-cmgi-200218461
- Wharton: https://knowledge.wharton.upenn.edu/article/factors-behind-global-crossings-failure/
- Google Search Trends: https://trends.google.com/trends/explore?date=today%205-y&q=AI%20Bubble&hl=en
- Bloomberg series
- Deutsche Bank: https://www.dbresearch.com/PROD/RI-PROD/PDFVIEWER.calias?pdfViewerPdfUrl=PROD0000000000604456
- CNBC: https://www.cnbc.com/2025/08/18/openai-sam-altman-warns-ai-market-is-in-a-bubble.html
- Bloomberg series
- FactSet: https://advantage.factset.com/hubfs/Website/Resources%20Section/Research%20Desk/Earnings%20Insight/EarningsInsight_100325A.pdf
- Business Insider: https://www.businessinsider.com/big-tech-ai-capex-infrastructure-data-center-wars-2025-10
- Morgan Stanley: https://www.morganstanley.com/insights/podcasts/thoughts-on-the-market/ai-investing-credit-markets-andrew-sheets
- Access Podcast via YouTube: https://www.youtube.com/watch?v=23FyskyFoP8&list=PLYBBGzU9Jm9kJX1OKqW3GdXA17KWCaqij
- Bloomberg: https://www.bloomberg.com/news/articles/2025-10-02/openai-completes-share-sale-at-record-500-billion-valuation
- Nvidia: https://nvidianews.nvidia.com/news/openai-and-nvidia-announce-strategic-partnership-to-deploy-10gw-of-nvidia-systems
- AMD: https://ir.amd.com/news-events/press-releases/detail/1260/amd-and-openai-announce-strategic-partnership-to-deploy-6-gigawatts-of-amd-gpus
- Wall Street Journal: https://www.wsj.com/tech/ai/openai-amd-deal-ai-chips-ed92cc42
- Fortune: https://fortune.com/2025/09/28/nvidia-openai-circular-financing-ai-bubble/
- LA Times Archive: https://www.latimes.com/archives/la-xpm-2003-may-25-fi-cisco25-story.html
Index Definitions
The S&P 500 Index is widely regarded as the best single gauge of the United States equity market. It includes 500 leading companies in leading industries of the U.S. economy. The S&P 500 focuses on the large cap segment of the market and covers approximately 75% of U.S. equities.
The Bloomberg Barclays U.S. Aggregate Index represents securities that are SEC-registered, taxable, and dollar denominated. The index covers the U.S. investment grade fixed rate bond market, with index components for government and corporate securities, mortgage pass-through securities, and asset-backed securities. Duration is roughly 5 years.
The Bloomberg U.S. Corporate High Yield Bond Index measures the USD-denominated, high yield, fixed-rate corporate bond market. Securities are classified as high yield if the middle rating of Moody’s, Fitch and S&P is Ba1/BB+/BB+ or below. Bonds from issuers with an emerging markets country of risk, based on the indices’ EM country definition, are excluded.
The Russell 2000® Index measures the performance of the small-cap segment of the US equity universe. It includes approximately 2000 of the smallest US equity securities in the Russell 3000 Index based on a combination of market capitalization and current index membership. The Russell 2000 Index represents approximately 10% of the total market capitalization of the Russell 3000 Index. Because the Russell 2000 serves as a proxy for lower quality, small cap stocks, it provides an appropriate benchmark for RMB Special Situations.
The U.S. Dollar Index is used to measure the value of the dollar against a basket of six foreign currencies: the euro, Swiss franc, Japanese yen, Canadian dollar, British pound, and Swedish krona.
MSCI U.S. REIT Index is a free float-adjusted market capitalization weighted index that is comprised of equity Real Estate Investment Trusts (REITs). The index is based on the MSCI USA Investable Market Index (IMI), its parent index, which captures the large, mid and small cap segments of the USA market. With 150 constituents, it represents about 99% of the US REIT universe and securities are classified under the Equity REITs Industry (under the Real Estate Sector) according to the Global Industry Classification Standard (GICS®), have core real estate exposure (i.e., only selected Specialized REITs are eligible) and carry REIT tax status.
Disclaimers
Performance Disclosures
All market pricing and performance data from Bloomberg, unless otherwise cited. Asset class and sector performance are gross of fees unless otherwise indicated.
The opinions and analyses expressed in this newsletter are based on Curi Capital, LLC’s (“Curi Capital”) research and professional experience are expressed as of the date of our mailing of this newsletter. Certain information expressed represents an assessment at a specific point in time and is not intended to be a forecast or guarantee of future results, nor is it intended to speak to any future time periods. Curi Capital makes no warranty or representation, express or implied, nor does Curi Capital accept any liability, with respect to the information and data set forth herein, and Curi Capital specifically disclaims any duty to update any of the information and data contained in this newsletter. The information and data in this newsletter does not constitute legal, tax, accounting, investment or other professional advice. Returns are presented net of fees. An investment cannot be made directly in an index. The index data assumes reinvestment of all income and does not bear fees, taxes, or transaction costs. The investment strategy and types of securities held by the comparison index may be substantially different from the investment strategy and types of securities held by your account.