
Key Takeaways
- Markets ended 2025 on a strong note: Not one major asset class ended the year in the red. U.S. large-cap stocks ended the year up 18%. U.S. small-cap stocks gained 13%, and U.S. intermediate-term bonds ended 2025 up 7%.
- Wage and wealth gaps continue to widen: The top 1% hold nearly one-third of U.S. household wealth, and roughly 40% of Americans own neither equities nor property.
- Headline inflation cooled to 2.7% year-over-year, driven largely by slowing shelter costs. This report took economists by surprise: None of the Bloomberg-surveyed economists predicted this low of a number.
- With approval ratings under pressure ahead of the midterm elections, policymakers have increasingly shifted their focus toward the lower-income consumer. The resulting policy mix is likely to remain accommodative, with implications for both the economy and financial markets.
Overview
Not one major asset class ended 2025 in the red. U.S. large-cap stocks ended the fourth quarter up 3% and ended the year up 18%. U.S. small-cap stocks gained 13% over the year after a fourth-quarter gain of 2%. U.S. intermediate-term bonds fared well in 2025, marking their strongest gains in five years. After rising 1% in the fourth quarter, the Bloomberg U.S. Aggregate Bond Index ended 2025 up 7%.
The “K” Divide
Economic growth was better than expected in the third quarter. Secondary estimates show that the U.S. economy expanded 4.3% quarter over quarter, annualized, well above the 3.3% consensus expectation.1 Growth is expected to slow in the fourth quarter, and annualized quarter-over-quarter GDP growth is projected to be around 1%, bringing the 2025 annual growth rate to roughly 2%. A similar pace is expected in 2026, and consensus forecasts point to an annual growth rate of approximately 2.1%.2
The strength in third-quarter economic growth was driven primarily by resilient consumer spending. Personal consumption rose by 3.5% during the quarter, marking the strongest increase of the year.3 Retail sales data for October (the most recent available data) showed solid spending, partially offset by a 1.6% month-over-month decline in motor vehicle sales.4 Control group retail sales, which feed directly into the GDP calculation for goods consumption, rose 0.8% in October, the largest increase in four months.4 The control group excludes food services, auto dealers, building materials stores, and gas stations. Notably, November “Black Friday” spending grew by just 3% year over year and buy-now-pay-later usage rose by 9% year over year and has increased by nearly $5 billion over the past three years.5
Spending growth has increasingly been supported by borrowed funds. Aggregate credit card limits have risen to a record $5.3 trillion, constituting a 35% increase over the past five years.6 Outstanding credit card balances now total $1.2 trillion, up 6% over the past 12 months.6 Credit card delinquencies, which had been trending lower, edged higher in the third quarter but remain well below 2008 peak levels.6 This deterioration coincides with a modest uptick in average domestic credit card interest rates at commercial banks, which declined from 22% in the third quarter of 2024 to 21% in the third quarter of 2025 but remains historically elevated.7

Rising credit card interest rates disproportionately burden lower-income consumers. These households are more likely to carry revolving balances, have limited access to lower-cost credit, and must allocate an increasing share of income toward interest payments—crowding out discretionary and, in some cases, essential spending. Consistent with this pressure, consumer confidence deteriorated sharply toward the end of 2025. The University of Michigan’s consumer sentiment survey experienced its second-lowest reading on record in November (51), surpassed only by June 2022’s reading of 50.8 Sentiment improved modestly in December, ending the year at 53, driven by a slight improvement in expectations for personal finances and business conditions over the coming year.9
A “K-shaped” economy describes a period in which parts of the economy move in different directions simultaneously, producing divergent outcomes. Consumer behavior currently reflects this divide: Higher-income households are spending with confidence while lower-income households are buckling under the combined pressure of rising costs and slowing income growth. Bank of America’s credit and debit card data illustrates a K-shaped spending picture. In November, lower-income households recorded a 0.6% year-over-year increase in their three-month average total card spending, compared with a 2.6% increase for higher-income households.10 Middle-income households saw spending rise by 1.4% year over year.10
This spending divergence is also evident in the Federal Reserve’s Beige Book, which compiles anecdotal evidence from across the twelve Federal Reserve districts on economic activity, labor markets, and inflation. According to the Federal Reserve Bank of San Francisco:
“Consumers at the lower end of the income distribution continued to reduce their discretionary spending, including on full-service restaurant dining, elective health care, entertainment, and beauty and personal services… Demand from consumers at the higher end of the income distribution was resilient.”11
Corporate commentary reinforces this narrative. At a conference in early December, Restaurant Brands International’s CEO Joshua Kobza observed:
“We have seen the lower-end consumer be a little bit softer. That’s been pretty persistent throughout this year. And we’ve seen a little bit more strength in the middle and upper tiers.”12
According to PayPal CFO Jamie Miller:
“We are a very middle-income, lower-income, main street America sort of consumer base in our portfolio. We also skew retail and a little bit more discretionary. And when you look at that, we continue to see consumers spending less, trading down, average order values down, and just a shifting in that space.”12
On the higher-income consumer, Disney CFO Hugh Johnston said during the company’s second quarter earnings call:
“Our consumer, as you know, tends to be at the higher income deciles, and those consumers continue to do well.”12
Echoing this assessment, Citizens Financial President Brendan Coughlin stated during the company’s third-quarter earnings call:
“It’s a K-shaped economy without question. You’re seeing significant stability and growth at the high end and some moderate signs of stress at the low end.”13
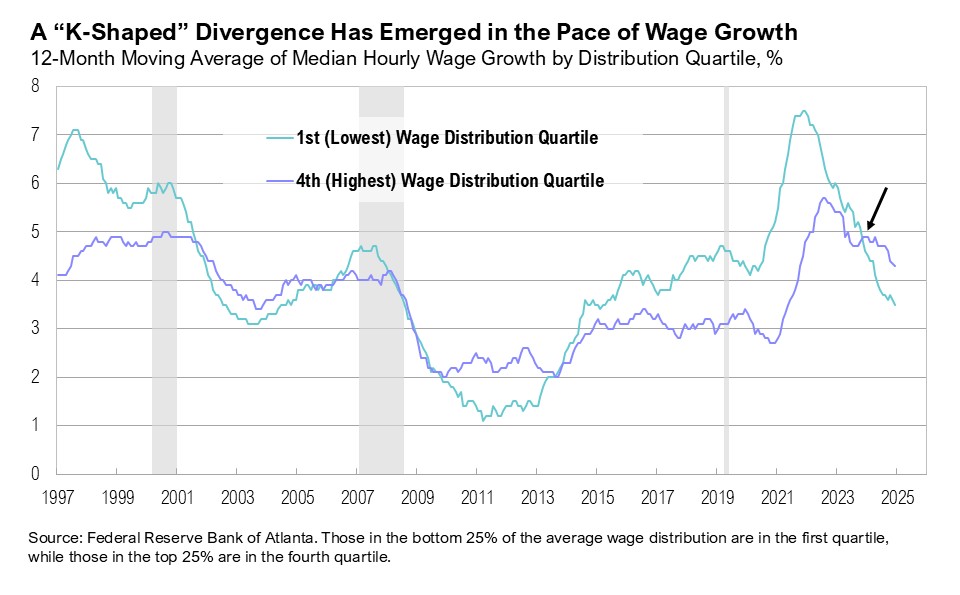
The K-shaped dynamic has also become increasingly visible in the labor market, particularly with wage growth. Since October 2024, there has been increasing disparity in wage growth between the lowest quartile and highest quartile of wage earners. In October 2024, wage growth was broadly aligned across income distribution demographics. Low- and high-income earners recorded nearly identical 12-month gains—4.8% and 4.9%, respectively.14 By November 2025, that relationship had clearly broken down: Wage growth for high-income earners was at 4.3% relative to a 3.5% pace for low-income earners.14
Wealth accumulation in the U.S. has become increasingly K-shaped. Asset holders—those invested in real estate or the stock market—have captured the lion’s share of gains while non-asset holders have been largely left behind. By mid-2025, the top 1% of households held 31% of total household wealth, compared with just 2.5% for the bottom 50%.15,16 Over the past decade, house prices have risen 173%, while household ownership of stocks has reached record levels, generating similar wealth gains for investors.17,18,19 Meanwhile, those unable to enter the housing market face rising barriers, and the median age of first-time homebuyers is now 40.20 According to the National Association of Retailers deputy chief economist Jessica Lautz:
“Unfolding in the housing market is a tale of two cities. We’re seeing buyers with significant housing equity making larger down payments and all-cash offers, while first-time buyers continue to struggle to enter the market.”20
A significant share of the U.S. population owns neither property nor equities. According to the Federal Reserve’s 2022 Survey of Consumer Finances, 58% of U.S. households owned equities at that time while a more recent May 2025 Gallup poll suggests ownership has risen modestly to approximately 62% of adults.19,21 The homeownership rate, which captures property ownership at the household level, stood at 65% in the third quarter of 2025, down from a peak of 69% in 2004 and a post-pandemic high of 68% in 2020.22 As a result, nearly 40% of Americans have not participated in the recent appreciation of equity and housing markets. This exclusion has contributed to a widening wealth divide, reinforcing the K-shaped dynamics already evident across spending and income.
Although inflation has decreased significantly from its four-decade high of 9% in June 2022, it has remained above the Federal Reserve’s official 2% target for 56 consecutive months. The latest report shows headline inflation easing to 2.7% year over year in November, largely driven by slowing shelter prices.23,24,25 The shelter component, which represents about 35% of the total CPI calculation, slowed from 3.8% in September 2025 to 3.0% in November, the lowest reading since August 2021.24 The CPI report took every economist by surprise. None of the Bloomberg-surveyed economists predicted this low of a number, and the closest estimate was from Citigroup at 2.8%.25, 26 Nonetheless, external data supports the broader trend, particularly for housing. Zillow and Apartment List show that shelter costs have cooled meaningfully. Apartment List reported a 1.3% month-over-month decline in rents in December—the largest drop since late 2023.27,28

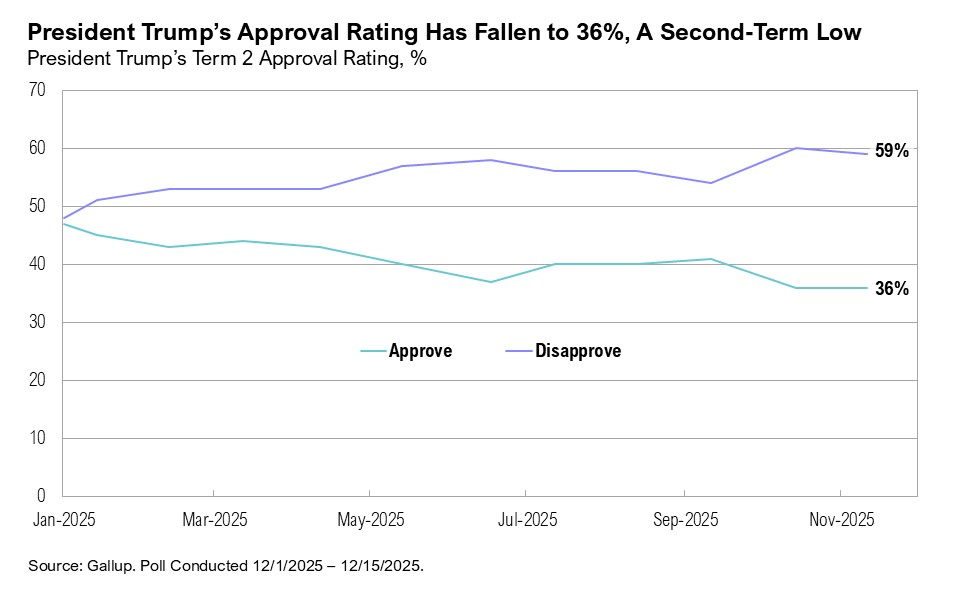
The presidential administration seems poised to focus on affordability in 2026, and it may have little choice if Republicans want to retain control in Congress. A Brookings study from August 2025 found that a president’s approval rating tends to impact the outcome of a midterm election: The higher the approval rating, the lower the losses that the president’s party will experience.29 President Trump’s approval rating remains low, at 36% —the lowest of his second term and second only to the 34% reading at the end of his first term—leaving him potentially vulnerable heading into midterms.29,30 Historical precedent suggests significant House of Representatives losses unless his approval rises well above 50%, which would require stronger support from lower-income households, young voters, and independents.29
Addressing affordability and inflation—and narrowing the “K”—will therefore be critical. A December 2025 Gallup poll found that 74% of Americans were dissatisfied with the state of the country (the worst reading since January) and identified the economy and inflation as the top issues.31 Similarly, an October 2025 Ipsos poll found that the cost of living was the single most important factor for voters when deciding how to cast their ballots at midterms.32
Recent policy proposals suggest affordability is a top priority for 2026. In 2025, one of the most notable initiatives was negotiating direct price reductions on high-cost pharmaceutical drugs, including insulin and weight-loss medications.33,34 The administration also followed through on its promise to eliminate taxes on tips and overtime pay, included in the One Big Beautiful Bill Act.35 In November, the IRS released guidance for workers claiming these deductions for the 2025 tax year; however, the overall impact on these workers may be more muted because some states, including Colorado, Illinois, New York, Maine and the District of Columbia, are prohibiting these provisions, citing budget deficits among other reasons.37,38 Approximately six million workers report tipped wages, and the current framework allows for a maximum annual deduction of $12,500 for individuals or $25,000 for joint filers.36
Despite the potential for market volatility during a midterm election year, earnings expectations for 2026 suggest another solid year for U.S. equities. FactSet forecasts mid-teens S&P 500 earnings growth in 2026, which, if realized, would be the highest since the post-pandemic rebound in 2021.39 Year-over-year earnings growth is currently projected at 15%, and the S&P 500’s estimated net profit margin of 13.9% would mark the highest annual margin since FactSet began tracking the data in 2008.39 Bloomberg currently estimates that the Russell 2000 small-cap index will deliver earnings growth of 56% in 2026, and ex-U.S. international developed markets are expected to see year-over-year earnings growth of 9%.
Notably, the S&P 493 (the S&P 500, minus the Magnificent 7 group of companies comprising Apple, Alphabet, Nvidia, Amazon, Meta, Microsoft, and Tesla) is expected to register double-digit growth in 2026—the first such increase in five years.39 Analysts are also projecting a roughly 10% potential gain for the S&P 500 in 2026.40 Notably, the spread between the highest and lowest year-end target is the narrowest since 2017.40 Overall, Wall Street’s 2026 S&P 500 forecasts appear uniformly bullish and tightly clustered.

A different kind of K is also emerging. In May, Federal Reserve Chair Jerome Powell’s term will end, meaning the announcement of the next Federal Reserve chair is imminent. Betting markets have two clear frontrunners in what has been dubbed, “A Battle of the Kevins”: Kevin Warsh (39% probability) and Kevin Hassett (40% probability).41 The new chair is widely expected to pursue further rate cuts, despite official Fed projections pricing in only one 25-basis-point cut in 2026, and market expectations currently pricing in two.42,43 At the December Federal Open Market Committee meeting, the Fed announced it would begin purchasing short-term Treasury securities to maintain an ample level of reserves.44 Treasury bill purchases, otherwise known as quantitative easing, began in December and are expected to run at roughly $40 billion per month.44 The expansion of the Fed’s balance sheet, combined with expectations of further rate cuts, suggests the likelihood of substantially easing of monetary policy in 2026.
Markets
International markets outperformed U.S. equities throughout 2025. U.S. large-cap stocks gained 3% in the fourth quarter, finishing the year up 18%. By comparison, international developed market equities rose 5% in the fourth quarter and ended the year up 32%. Emerging market equities gained 5% in the fourth quarter, driven by strong performances in Chile (+25%), Colombia (+18%), and South Africa (+14%). For the full year, emerging markets advanced 34%, making them the top-performing major equity market in 2025.
U.S. intermediate-term bonds rose 1% in the fourth quarter while international developed market bonds declined by 2%. U.S. intermediate-term bonds ended 2025 up 7% while international developed market bonds gained 8%. Gold prices rose 13% in the fourth quarter, reaching a new record high on December 26 and surpassing $4,500 per ounce for the first time. Gold finished 2025 up 65%. After falling to a five-year low of $56 per barrel on December 15, West Texas Intermediate (WTI) crude oil ended the year at $58 per barrel. U.S. national average gasoline prices also reached a five-year low, falling to $2.80 per gallon on December 29.
In other international markets, Sanae Takaichi was elected leader of Japan’s ruling Liberal Democratic Party in early October and has since become the country’s first female prime minister. In November, the Japanese government approved a $135 billion (¥21 trillion) stimulus package, focused on inflation relief, including tax cuts, energy subsidies, and household support.45 While supportive of consumption, the package has raised concerns about fiscal discipline. Long-term Japanese government bond yields hit record highs, and the yen has remained near multi-decade lows. Japanese equities have nonetheless performed well, and the MSCI Japan index have increased 25% over the year.

Looking Forward
Just as the Mar-a-Lago Accord provided a post-election blueprint from the new administration in 2025, the administration’s increasing focus on the lower-income consumer—the lower line of the “K”—is critical for understanding the economic, policy, and market backdrop heading into 2026.
To date, policymakers appear to be responding to weak consumer sentiment and the marginal deterioration in income and spending behaviour among lower-income households as though the economy is entering a broader slowdown. The Federal Reserve has already pivoted toward a more accommodative stance, lowering interest rates and restarting balance sheet expansion, while deficit spending is expected to remain elevated, with the federal deficit projected to reach approximately $1.7 trillion in 2026 according to the Congressional Budget Office’s most recent baseline estimates.46
From a forward-return perspective, the starting conditions for U.S. investors are less favourable. U.S. large-cap equity valuations are elevated, credit spreads are near multi-decade lows, Wall Street’s return expectations remain broadly optimistic, and 2026 is a midterm election year, which has historically been associated with more muted average returns. That said, we believe the policy backdrop supports staying the course in diversified portfolios, and we continue to see attractive opportunities in a number of differentiated themes—including U.S. small-cap and international stocks and other tactical exposures.
As long-term focused investors, we believe that time in the market beats timing the market. The longer the holding period, the more consistent the results. However, entry valuations are critical: buying securities when valuations are low has, on average, generated better performance over the long-run than buying when valuations are high, and valuations are unambiguously high today. This all suggests some caution, even acknowledging that market downturns and bubbles are unpredictable.
That said, there are bifurcations in the capital markets as always. In 2025, some assets performed more modestly while others roared ahead. We are leaning into the parts of the market that may have been left behind, reallocating to asset classes and companies that have been out of favor and we believe offer the best risk-adjusted returns.
Performance Disclosures
All market pricing and performance data from Bloomberg, unless otherwise cited. Asset class and sector performance are gross of fees unless otherwise indicated.
Citations
- Bureau of Economic Analysis: https://www.bea.gov/data/gdp/gross-domestic-product
- Bloomberg: https://www.bloomberg.com/graphics/2026-investment-outlooks/
- Bureau of Economic Analysis: https://www.bea.gov/sites/default/files/2025-12/gdp3q25-ini.pdf
- U.S. Census Bureau: https://www.census.gov/retail/sales.html
- Adobe Analytics: https://news.adobe.com/news/2025/12/adobe-cyber-monday-hits-record
- Federal Reserve Bank of New York: https://www.newyorkfed.org/medialibrary/interactives/householdcredit/data/pdf/HHDC_2025Q3
- Federal Reserve Bank of St. Louis: https://fred.stlouisfed.org/series/TERMCBCCALLNS
- Federal Reserve Bank of St. Louis: https://fred.stlouisfed.org/series/UMCSENT
- University of Michigan: https://www.sca.isr.umich.edu/
- Bank of America: https://institute.bankofamerica.com/content/dam/economic-insights/consumer-checkpoint-december-2025.pdf
- Federal Reserve: https://www.federalreserve.gov/monetarypolicy/files/BeigeBook_20251126.pdf
- The Transcript: https://thetranscript.substack.com/p/12-15-2025-broad-range-of-neutral-free?utm_campaign=post&utm_medium=email&triedRedirect=true
- Barron’s: https://www.barrons.com/articles/banks-economy-consumer-spending-delinquencies-e9e24580
- Federal Reserve Bank of Atlanta: https://www.atlantafed.org/chcs/wage-growth-tracker#Tab1
- Federal Reserve Bank of St. Louis: https://fred.stlouisfed.org/series/WFRBST01134
- Federal Reserve Bank of St. Louis: https://fred.stlouisfed.org/series/WFRBSB50215
- Federal Reserve Bank of St. Louis: https://fred.stlouisfed.org/series/OEHRENWBSHNO
- Markets.com: https://www.markets.com/analysis/us-household-stock-ownership-risks-1181-en
- Gallup: https://news.gallup.com/poll/266807/percentage-americans-owns-stock.aspx
- National Association of Realtors: https://www.nar.realtor/newsroom/first-time-home-buyer-share-falls-to-historic-low-of-21-median-age-rises-to-40
- Federal Reserve: https://www.federalreserve.gov/publications/files/scf23.pdf
- Federal Reserve Bank of St. Louis: https://fred.stlouisfed.org/series/RHORUSQ156N
- Bureau of Labor Statistics: https://www.bls.gov/news.release/cpi.nr0.htm
- Federal Reserve Bank of St. Louis: https://fred.stlouisfed.org/series/CUSR0000SAH1#
- Bloomberg: https://www.bloomberg.com/opinion/articles/2025-12-18/cpi-a-great-inflation-report-doesn-t-quite-stand-up-to-scrutiny
- Bloomberg: https://www.bloomberg.com/news/live-blog/2025-12-18/us-cpi-report-for-november
- Zillow: https://www.zillow.com/research/data/
- Apartment List: https://www.apartmentlist.com/research/national-rent-data
- Brookings: https://www.brookings.edu/articles/what-history-tells-us-about-the-2026-midterm-elections/
- Gallup: https://news.gallup.com/interactives/507569/presidential-job-approval-center.aspx
- Gallup: https://news.gallup.com/poll/700241/americans-end-year-gloomy-mood.aspx
- Ipsos: https://www.ipsos.com/en-us/cost-living-concerns-will-loom-large-midterms
- CNBC: https://www.cnbc.com/2025/12/19/nine-pharma-companies-ink-deals-with-trump-to-lower-drug-prices.html
- Wall Street Journal: https://www.wsj.com/health/pharma/u-s-negotiates-lower-prices-for-ozempic-and-14-other-drugs-c410e72c
- IRS: https://www.irs.gov/newsroom/one-big-beautiful-bill-act-tax-deductions-for-working-americans-and-seniors
- IRS: https://www.irs.gov/newsroom/treasury-irs-provide-guidance-for-individuals-who-received-tips-or-overtime-during-tax-year-2025
- Newsweek: https://www.newsweek.com/map-states-trump-tax-cuts-will-wont-take-effect-11085807
- Washington Examiner: https://www.washingtonexaminer.com/policy/finance/3913592/scott-bessent-slams-blue-states-declining-one-big-beautiful-bill-act-tax-relief/
- FactSet: https://insight.factset.com/sp-500-cy-2026-earnings-preview-analysts-expect-earnings-growth-of-15
- Bloomberg: https://www.bloomberg.com/news/newsletters/2026-01-06/stock-bulls-dominate-in-survey-of-2026-sentiment
- Polymarket: https://polymarket.com/event/who-will-trump-nominate-as-fed-chair
- Federal Reserve: https://www.federalreserve.gov/monetarypolicy/files/fomcprojtabl20251210.pdf
- CME FedWatch: https://www.cmegroup.com/markets/interest-rates/cme-fedwatch-tool.html
- Federal Reserve: https://www.federalreserve.gov/mediacenter/files/FOMCpresconf20251210.pdf
- CNBC: https://www.cnbc.com/2025/11/21/japans-cabinet-announces-135-billion-stimulus-package-nhk.html
- Congressional Budget Office: https://www.cbo.gov/system/files/2025-01/60870-Outlook-2025.pdf
Index Definitions
The S&P 500 Index is widely regarded as the best single gauge of the United States equity market. It includes 500 leading companies in leading industries of the U.S. economy. The S&P 500 focuses on the large cap segment of the market and covers approximately 75% of U.S. equities.
The Bloomberg Barclays U.S. Aggregate Index represents securities that are SEC-registered, taxable, and dollar denominated. The index covers the U.S. investment grade fixed rate bond market, with index components for government and corporate securities, mortgage pass-through securities, and asset-backed securities. Duration is roughly 5 years.
The Bloomberg U.S. Corporate High Yield Bond Index measures the USD-denominated, high yield, fixed-rate corporate bond market. Securities are classified as high yield if the middle rating of Moody’s, Fitch and S&P is Ba1/BB+/BB+ or below. Bonds from issuers with an emerging markets country of risk, based on the indices’ EM country definition, are excluded.
The Russell 2000® Index measures the performance of the small-cap segment of the US equity universe. It includes approximately 2000 of the smallest US equity securities in the Russell 3000 Index based on a combination of market capitalization and current index membership. The Russell 2000 Index represents approximately 10% of the total market capitalization of the Russell 3000 Index. Because the Russell 2000 serves as a proxy for lower quality, small cap stocks, it provides an appropriate benchmark for RMB Special Situations.
The U.S. Dollar Index is used to measure the value of the dollar against a basket of six foreign currencies: the euro, Swiss franc, Japanese yen, Canadian dollar, British pound, and Swedish krona.
MSCI U.S. REIT Index is a free float-adjusted market capitalization weighted index that is comprised of equity Real Estate Investment Trusts (REITs). The index is based on the MSCI USA Investable Market Index (IMI), its parent index, which captures the large, mid and small cap segments of the USA market. With 150 constituents, it represents about 99% of the US REIT universe and securities are classified under the Equity REITs Industry (under the Real Estate Sector) according to the Global Industry Classification Standard (GICS®), have core real estate exposure (i.e., only selected Specialized REITs are eligible) and carry REIT tax status.
Disclaimers
*Source: MSCI.MSCI makes no express or implied warranties or representations and shall have no liability whatsoever with respect to any MSCI data contained herein. The MSCI data may not be further redistributed or used as a basis for other indexes or any securities or financial products. This report is not approved, endorsed, reviewed or produced by MSCI. None of the MSCI data is intended to constitute investment advice or a recommendation to make (or refrain from making) any kind of investment decision and may not be relied on as such.
The opinions and analyses expressed in this newsletter are based on Curi Capital, LLC’s (“Curi Capital”) research and professional experience are expressed as of the date of our mailing of this newsletter. Certain information expressed represents an assessment at a specific point in time and is not intended to be a forecast or guarantee of future results, nor is it intended to speak to any future time periods. Curi Capital makes no warranty or representation, express or implied, nor does Curi Capital accept any liability, with respect to the information and data set forth herein, and Curi Capital specifically disclaims any duty to update any of the information and data contained in this newsletter. The information and data in this newsletter does not constitute legal, tax, accounting, investment or other professional advice. Returns are presented net of fees. An investment cannot be made directly in an index. The index data assumes reinvestment of all income and does not bear fees, taxes, or transaction costs. The investment strategy and types of securities held by the comparison index may be substantially different from the investment strategy and types of securities held by your account.