
Summary
- Geopolitical conflict, as well as concerns about the impacts of AI, shaped market returns in the first quarter.
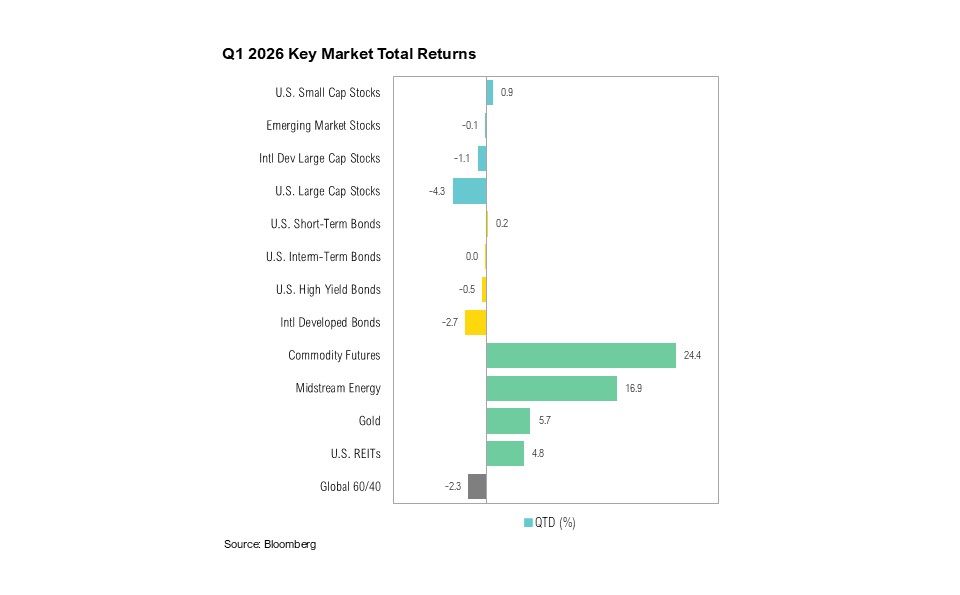
- U.S. large-cap stocks ended the quarter down 4.3%, and U.S. small-cap stocks gained 0.9%. U.S. intermediate-term bonds ended the quarter flat.
- U.S.–Israeli strikes on Iran effectively closed the Strait of Hormuz. Crude oil surged from $57 to $101 per barrel in March. This pushed U.S. fuel prices to four-year highs, amplifying inflationary pressures.
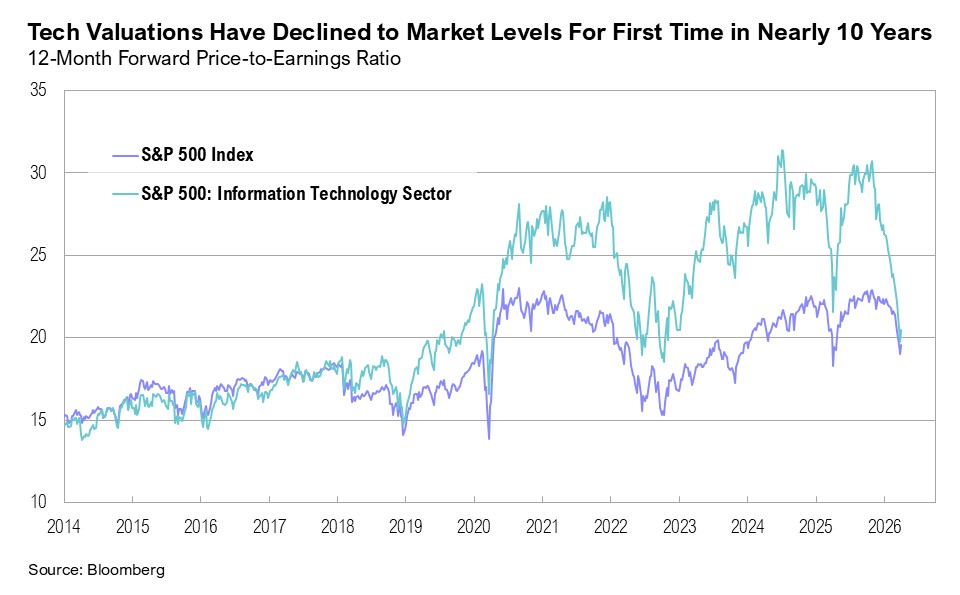
- The “SaaSpocalypse” pushed software stocks down 30–50%, the result of fears that AI dominance will threaten traditional software licensing models. Technology sector valuations fell to broader market levels for the first time in nearly a decade.
- Despite geopolitical-driven volatility, credit and futures markets remained stable, indicating that underlying fundamentals were stable and that patience, not reaction, may be the optimal strategy.
Overview
Geopolitical conflict, combined with increased uncertainty about the potential disruption from AI dominance shaped first-quarter returns. U.S. large-cap stocks (as proxied by the S&P 500 Index) closed at a new all-time high on January 27, but ended the quarter down 4.3%. U.S. small-cap stocks, as represented by the Russell 2000 Index, fared better, finishing the quarter up 0.9%. U.S. intermediate-term bonds (the Bloomberg U.S. Aggregate Bond Index) ended the quarter flat.
The U.S. economy added 205,000 jobs over the first three months of 2026. In February, however, jobs declined by 133,000, largely due to adverse weather conditions and worker strikes, but this notable decline was offset by a rebound of 178,000 new jobs in March1. Overall, layoffs remain below 2025 levels when a wave of federal job cuts were cut after President Trump took office. In the first quarter of 2026, U.S. employers announced just over 217,000 job cuts—the lowest first-quarter total since 2022. The technology sector recorded the highest number of layoffs year-to-date (52,000 jobs cut), followed by transportation, which saw over 32,000 jobs lost.2
The quarter ended in the middle of tax filing season. So far, many taxpayers have received larger refunds than in recent years. This was driven primarily by the One Big Beautiful Bill Act (OBBBA). As of late March 2026, the average refund was $3,521—up roughly 14% from a year earlier and the highest since 2022, according to the IRS.3
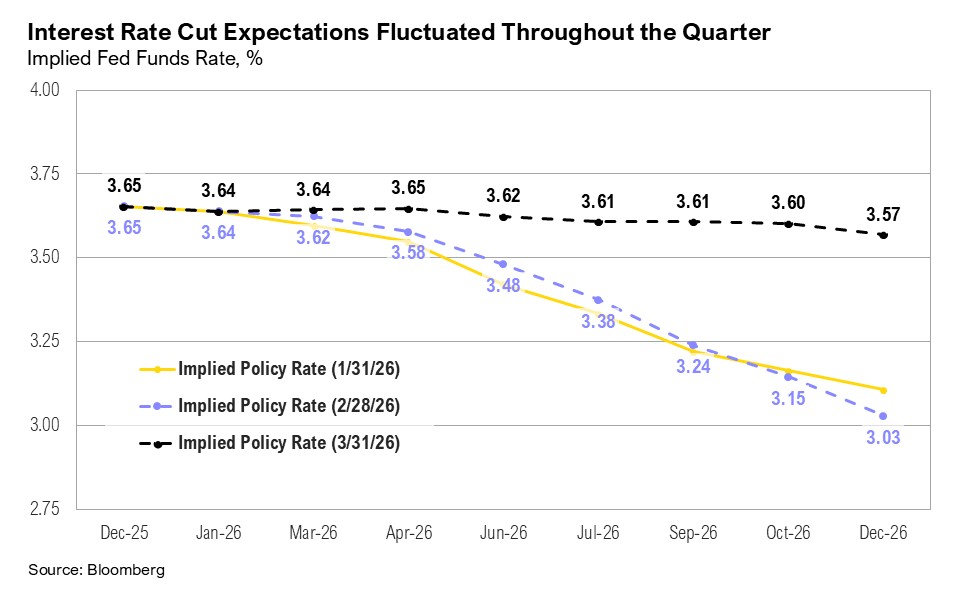
As expected, the Federal Reserve kept interest rates unchanged at its March Federal Open Market Committee (FOMC) meeting. According to projections, Fed officials no longer expect any changes in interest rates for 2026.4 Market expectations for the rate path fluctuated throughout the quarter, ranging from two 0.25% cuts to a small probability of a 0.25% hike, but ultimately converged with the Fed’s guidance for no cuts in 2026.5 Current Fed Chair Jerome Powell’s term ends in May, and Kevin Warsh has been nominated as his successor. His confirmation hearing was scheduled for April 16 but appears to have been delayed with a new date not yet scheduled.6,7
The 2025 earnings season concluded in March. S&P 500 earnings grew by a solid 14% for the year.8 Technology (+28%), communication services (+19%), and industrial (+14%) were the best-performing sectors.8 Looking ahead, earnings growth estimates for the first quarter have improved modestly, rising from 12.8% at the start of the year to 13.2% by the end of March. At the sector level, technology (+45%), materials (+24%), and financials (+15%) are expected to drive first-quarter earnings growth.8
Dire Straits
The Strait of Hormuz, situated between Iran and Oman and just 30 miles wide at its narrowest point, is one of the world’s most critical energy chokepoints. Approximately 20 million barrels of oil per day, or nearly 25% of global seaborne supply, passes through the Strait via two unidirectional shipping lanes.9
On February 28, a coordinated strike by U.S. and Israeli forces targeted Iran’s leadership, military command centers, air defense systems, missile launch sites, naval facilities, and elements of its nuclear and missile infrastructure. The initial strike killed Iran’s Supreme Leader and much of the Islamic Revolutionary Guard Corps’ command structure.10 Iran retaliated with a series of missile and drone attacks across the region, including strikes on Gulf energy infrastructure across Qatar, Saudi Arabia, the United Arab Emirates, and Bahrain.11 In Qatar, attacks impacted a major domestic LNG producer, temporarily disabling roughly 17% of capacity, with repairs expected to take three to five years.11
The conflict led to a de facto closure of the Strait of Hormuz, severely constraining global oil flows.12 While non-U.S. and non-Israeli vessels have reportedly been allowed transit, overall traffic remains significantly reduced. As a result, export-dependent producers, including Iraq, Saudi Arabia, the UAE, Qatar, and Bahrain, collectively temporarily stopped or reduced output, reducing crude oil production by an estimated 7.5 million barrels per day in March.13
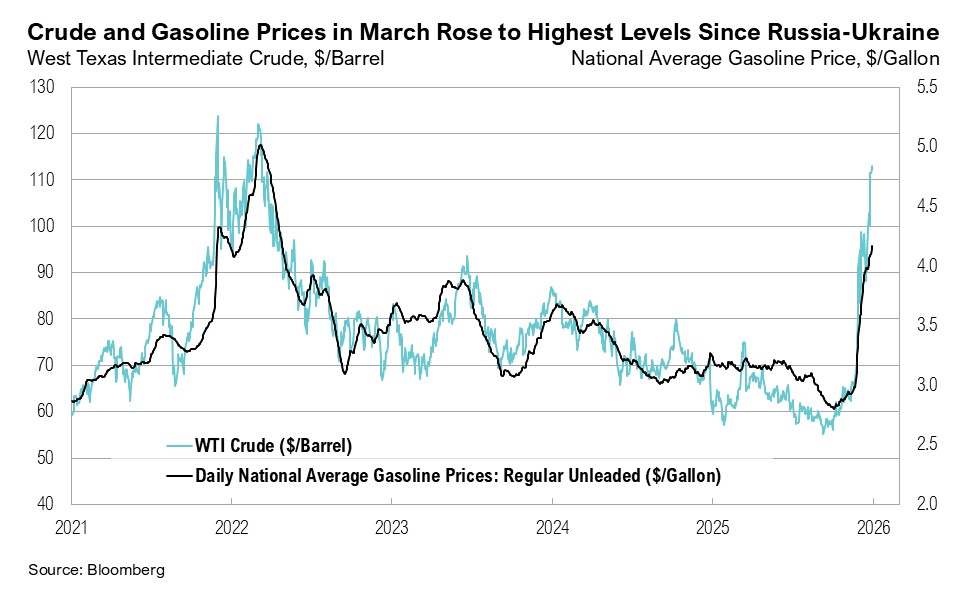
Crude oil and refined fuel prices surged in response. West Texas Intermediate (WTI) crude began the year at approximately $57 per barrel and ended the first quarter at $101 per barrel. U.S. retail fuel prices followed suit. By the end of March, national average gasoline prices reached $4.06 per gallon, and diesel hit $5.40, both the highest since 2022.14 In response, the U.S. announced a release of 172 million barrels from the Strategic Petroleum Reserve in March, although the phased deployment implies that meaningful relief is unlikely before mid-to-late July.15
In late March, the U.S. tabled a 15-point proposal to Iran (reportedly conveyed via Pakistan) aimed at curbing Tehran’s nuclear and missile programs in exchange for phased sanctions relief and security guarantees.16 After President Trump ramped up threats further, a two-week ceasefire agreement was reached in early April.17
The outlook for energy prices remains highly dependent on the status of the Strait of Hormuz. Oil markets indicate the conflict is expected to resolve beyond a temporary ceasefire in the near future, and December futures ended March at around $70 per barrel. The U.S. Energy Information Administration (EIA) has projected that the conflict will not extend significantly beyond April.18 Betting market probabilities suggested it will conclude by May 31.19 The EIA expects production shut-ins to peak in April before declining through the second half of the year. Retail fuel prices are expected to normalize, but not until year end.18 The slow normalization of energy prices is often referred to as a “rockets and feathers” effect. For example, fuel prices rise rapidly when crude oil increases, but fall more slowly when it declines. The lag is driven by both physical supply chain mechanics (since it typically takes four to six weeks for crude to be refined, distributed, and sold as gasoline) and retailer behavior.20
Energy accounts for between 7% and 8% of inflation, and it has further indirect effects on inflation via transportation, logistics, and production costs, creating broader but more gradual second-round inflationary pressures across goods and services.21 Headline inflation rose 0.9% month-over-month in March, reaching 3.3% year-over-year, as energy prices jumped by 11% in March.22
The administration entered 2026 with affordability, including housing, credit card interest rates, healthcare costs, and gasoline prices, as a defining priority, a political narrative it built before the November midterm elections. The conflict in the Middle East and the subsequent closure of the Strait of Hormuz led to a surge in energy prices that has fed directly into rising inflation expectations and the increased likelihood of a stagflationary environment (slowing economic growth, higher unemployment, and rising inflation) in 2026.
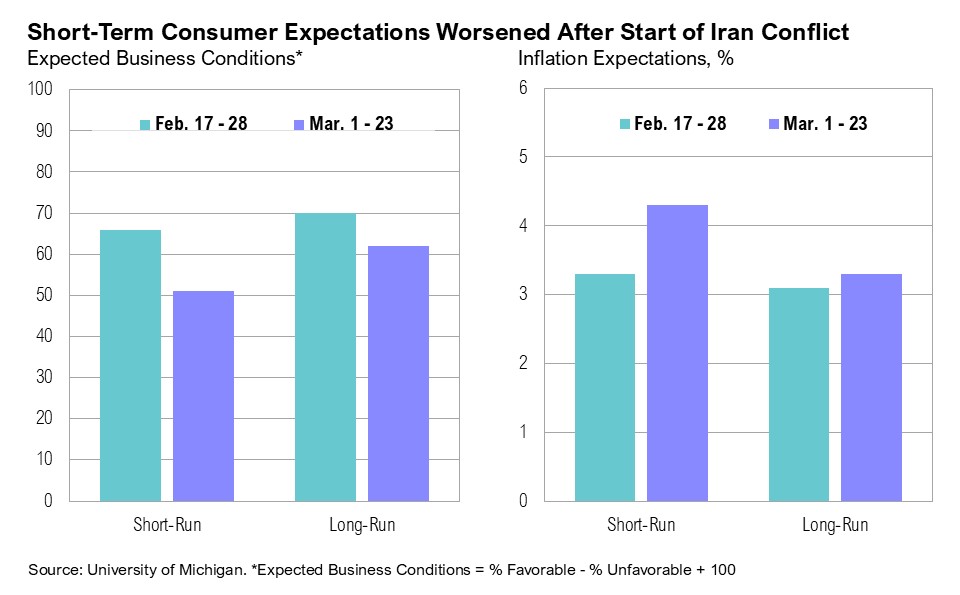
The Cleveland Fed’s inflation nowcast, the Atlanta Fed’s GDPNow forecast, and survey-based measures such as the University of Michigan consumer survey point to a clear re-acceleration in inflation momentum and a slowdown in economic growth. The Cleveland Fed nowcast expects headline inflation to rise to 3.3% year-over-year in March and 3.6% in April, while the Atlanta Fed’s GDPNow forecast for the first quarter fell from 3.1% in mid-February to 1.9% by quarter-end. Preliminary April results shows that the University of Michigan’s one-year consumer inflation expectations increased from 3.8% to 4.8%.23,24,25
In early February, markets experienced a sharp sell-off across the technology sector, particularly in the software segment, amid rising concerns that AI agents will erode traditional per-seat licensing models. The move, dubbed the “SaaSpocalypse,” was catalyzed by updates to Anthropic’s Claude model, which proved that more advanced AI models could handle complex tasks across different business systems.26, 27 The reaction was swift, pushing many into dire straits. Software stocks fell more than 30% from late-2025 highs, and some names declined by over 50%. After trading at a persistent premium for over a decade, software valuations compressed sharply, converging with S&P 500 price-to-earnings levels for the first time since the early 2010s.
AI-related disruption is also now affecting employment data. Technology layoffs have increased year-to-date, as companies reallocate budgets toward AI investment and reduce roles—particularly in coding and support functions.2 For example, Dell reduced its workforce by 10% over the past year, and Oracle reportedly cut 30,000 jobs.28 While these changes are not yet broad-based, the direction is clear: AI is reshaping the workforce requirements in certain sectors, and companies are shifting budgets towards AI investments, increasingly at the expense of headcount.
Market positioning around AI remains crowded. “AI” was mentioned by a record 331 S&P 500 companies during fourth-quarter earnings calls.29 At the same time, broader tech valuations decreased meaningfully. For example, Nvidia’s 12-month forward price-to-earnings ratio declined to 18.8x at the end of the quarter, its lowest level in at least five years.30 Valuation compression occurred over the quarter, even as earnings expectations strengthened, rising from 29% at the end of 2025 to 37% growth for 2026 by the end of March. The tech sector is expected to deliver the strongest revenue growth across the S&P 500 in 2026 (23%), and positive guidance (64%) remains well above historical averages (32%).8
Markets
U.S. large-cap stocks declined by 4.3% over the quarter, but remain only 6% below all-time highs, a relatively muted drawdown considering we are experiencing the largest oil price shock since the pandemic and the most significant drop in the S&P 500’s largest sector, technology—all happening in the same three-month period. U.S. small-cap stocks were a relative outperformer, ending the first quarter up 0.9%.
Emerging markets were resilient, particularly given disproportionate exposure to Middle Eastern oil, ending the quarter down only 0.1%. International developed large-cap stocks (predominantly European markets) ended the quarter down 1.1%. Among emerging markets, Peru (+21%), Brazil (+19%), and South Korea (+17%) led the gains. Indonesia (-21%), India (-18%), and China (-9%) stood out as notable laggards. In developed markets, European countries saw notable declines over the quarter, including Germany (-9%) and France (-5%).
Fixed-income markets had a muted start to the year. U.S. intermediate-term bonds ended the quarter flat. After rising to 4.4% on March 27, the 10-year U.S. Treasury yield ended the quarter at 4.3%. The yield curve (the spread between the 10-year and 2-year Treasury yields) remained positive throughout the quarter, finishing March at 0.5%.
Gold gained nearly 6% over the quarter, despite a 12% drop in March. Driven by the conflict in the Middle East, which started on the last day of February, West Texas Intermediate (WTI) crude oil prices jumped by $44 per barrel over the quarter to end at $101 per barrel. WTI crude prices dropped by 16% to $94 per barrel on news of a two-week ceasefire in early April.
Looking Forward
Two questions hang over markets today. First, how long will tanker traffic in the Strait remain disrupted? Every week of continued disruption compounds fertilizer, food, and energy price increases and delays the Fed’s ability to resume its easing path (although we do not anticipate major policy changes in the first few months of Warsh’s term as Fed Chair). A strategic pivot toward de-escalation, framed as a policy success, appears to be the only viable path forward for the government, though it is likely not what the Trump administration had in mind when strikes began. Without a sustained ceasefire in the coming weeks, markets will likely begin to anticipate a global stagflationary slowdown, including potential recessions for economies that are heavily dependent on imported energy. European and Asian economies dependent on imported Middle East crude oil are likely to be disproportionately affected, potentially left in dire straits.
Second, we are monitoring whether the “SaaSpocalypse” is simply a repricing moment or an extinction event for software. History suggests the former. What has been dubbed the “SaaSpocalypse” could perhaps be a long-overdue correction dressed in apocalyptic language. The companies most likely to emerge stronger are those with durable data moats, outcome-based pricing models, and genuine AI integration—not those that just sell basic software access by the seat. Further, if AI advancements are so profoundly disruptive that market participants can simply “vibe-code” secure and scalable software solutions to any data-based task, then that would likely be quite positive for the other roughly 90% of the stock market that isn’t SaaS.
Looking back over the quarter and in particular the conflict that defined it, the optimal strategy from an investment perspective may have been to do nothing, treating recent turbulence as a short-term shock. Credit spreads never spiked meaningfully, and crude oil futures do not signal a sustained supply shock. Although supply disruptions will likely persist, effects appear likely to be temporary rather than structurally transformative. Conditions on the ground may change, of course, and if they do, we can change our minds with them.
Performance Disclosures
All market pricing and performance data from Bloomberg, unless otherwise cited. Asset class and sector performance are gross of fees unless otherwise indicated.
Citations
- Bureau of Labor Statistics: https://www.bls.gov/news.release/empsit.nr0.htm
- Challenger, Gray & Christmas: https://www.challengergray.com/blog/challenger-report-march-cuts-rise-25-from-february-ai-leads-reasons/
- IRS: https://www.irs.gov/newsroom/filing-season-statistics-for-week-ending-march-27-2026
- Federal Reserve: https://www.federalreserve.gov/monetarypolicy/files/fomcprojtabl20260318.pdf
- CME FedWatch: https://www.cmegroup.com/markets/interest-rates/cme-fedwatch-tool.html
- CNBC: https://www.cnbc.com/2026/04/10/warsh-fed-nomination-hearing-delayed.html
- Financial Times: https://www.ft.com/content/5a078a3a-9580-47c1-9cb3-8c657457896d?syn-25a6b1a6=1
- FactSet: https://advantage.factset.com/hubfs/Website/Resources%20Section/Research%20Desk/Earnings%20Insight/EarningsInsight_040226.pdf
- IEA: https://www.iea.org/about/oil-security-and-emergency-response/strait-of-hormuz
- NPR: https://www.npr.org/2026/02/28/nx-s1-5730158/israel-iran-strikes-trump-us
- Reuters: https://www.reuters.com/world/china/trump-criticises-allies-over-rejection-hormuz-request-iran-israel-trade-2026-03-17/
- Bloomberg: https://www.bloomberg.com/news/articles/2026-03-30/energy-crisis-iran-s-grip-on-hormuz-is-tighter-than-ever-after-a-month-of-war
- Reuters: https://www.reuters.com/business/energy/middle-east-oil-exports-drop-least-60-hormuz-stays-mostly-closed-data-shows-2026-03-16/
- AAA: https://gasprices.aaa.com/for-the-first-time-in-four-years-national-average-exceeds-4-gallon/
- U.S. Department of Energy: https://www.energy.gov/articles/united-states-release-172-million-barrels-oil-strategic-petroleum-reserve
- BBC: https://www.bbc.com/news/articles/cvgkv9y97n0o
- Bloomberg: https://www.bloomberg.com/news/articles/2026-04-11/us-iran-officials-begin-talks-with-pakistan-on-ending-war
- U.S. Energy Information Administration: https://www.eia.gov/outlooks/steo/pdf/steo_full.pdf
- Polymarket: https://polymarket.com/event/us-x-iran-ceasefire-by
- Federal Reserve Bank of St. Louis: https://fredblog.stlouisfed.org/2022/06/oil-and-gas-prices-move-together-like-rockets-and-feathers/
- Bureau of Labor Statistics: https://www.bls.gov/cpi/tables/relative-importance/2025.htm
- Bureau of Labor Statistics: https://www.bls.gov/news.release/cpi.nr0.htm
- Federal Reserve Bank of Cleveland: https://www.clevelandfed.org/indicators-and-data/inflation-nowcasting
- Federal Reserve Bank of Atlanta: https://www.atlantafed.org/research-and-data/data/gdpnow/current-and-past-gdpnow-commentaries
- University of Michigan: https://www.sca.isr.umich.edu/
- CNBC: https://www.cnbc.com/2026/02/06/ai-anthropic-tools-saas-software-stocks-selloff.html
- Bloomberg: https://www.bloomberg.com/news/articles/2026-02-04/what-s-behind-the-saaspocalypse-plunge-in-software-stocks
- TrueUp: https://www.trueup.io/layoffs
- FactSet: https://advantage.factset.com/hubfs/Website/Resources%20Section/Research%20Desk/Earnings%20Insight/EarningsInsight_031226.pdf
- Reuters: https://www.reuters.com/business/nvidias-pe-sinks-seven-year-low-war-ai-angst-weigh-2026-03-30/
Index Definitions
The S&P 500 Index is widely regarded as the best single gauge of the United States equity market. It includes 500 leading companies in leading industries of the U.S. economy. The S&P 500 focuses on the large cap segment of the market and covers approximately 75% of U.S. equities.
The Bloomberg Barclays U.S. Aggregate Index represents securities that are SEC-registered, taxable, and dollar denominated. The index covers the U.S. investment grade fixed rate bond market, with index components for government and corporate securities, mortgage pass-through securities, and asset-backed securities. Duration is roughly 5 years.
The Bloomberg U.S. Corporate High Yield Bond Index measures the USD-denominated, high yield, fixed-rate corporate bond market. Securities are classified as high yield if the middle rating of Moody’s, Fitch and S&P is Ba1/BB+/BB+ or below. Bonds from issuers with an emerging markets country of risk, based on the indices’ EM country definition, are excluded.
The Russell 2000® Index measures the performance of the small-cap segment of the US equity universe. It includes approximately 2000 of the smallest US equity securities in the Russell 3000 Index based on a combination of market capitalization and current index membership. The Russell 2000 Index represents approximately 10% of the total market capitalization of the Russell 3000 Index. Because the Russell 2000 serves as a proxy for lower quality, small cap stocks, it provides an appropriate benchmark for RMB Special Situations.
The U.S. Dollar Index is used to measure the value of the dollar against a basket of six foreign currencies: the euro, Swiss franc, Japanese yen, Canadian dollar, British pound, and Swedish krona.
MSCI U.S. REIT Index is a free float-adjusted market capitalization weighted index that is comprised of equity Real Estate Investment Trusts (REITs). The index is based on the MSCI USA Investable Market Index (IMI), its parent index, which captures the large, mid and small cap segments of the USA market. With 150 constituents, it represents about 99% of the US REIT universe and securities are classified under the Equity REITs Industry (under the Real Estate Sector) according to the Global Industry Classification Standard (GICS®), have core real estate exposure (i.e., only selected Specialized REITs are eligible) and carry REIT tax status.
Disclaimers
*Source: MSCI.MSCI makes no express or implied warranties or representations and shall have no liability whatsoever with respect to any MSCI data contained herein. The MSCI data may not be further redistributed or used as a basis for other indexes or any securities or financial products. This report is not approved, endorsed, reviewed or produced by MSCI. None of the MSCI data is intended to constitute investment advice or a recommendation to make (or refrain from making) any kind of investment decision and may not be relied on as such.
The opinions and analyses expressed in this newsletter are based on Curi Capital, LLC’s (“Curi Capital”) research and professional experience are expressed as of the date of our mailing of this newsletter. Certain information expressed represents an assessment at a specific point in time and is not intended to be a forecast or guarantee of future results, nor is it intended to speak to any future time periods. Curi Capital makes no warranty or representation, express or implied, nor does Curi Capital accept any liability, with respect to the information and data set forth herein, and Curi Capital specifically disclaims any duty to update any of the information and data contained in this newsletter. The information and data in this newsletter does not constitute legal, tax, accounting, investment or other professional advice. Returns are presented net of fees. An investment cannot be made directly in an index. The index data assumes reinvestment of all income and does not bear fees, taxes, or transaction costs. The investment strategy and types of securities held by the comparison index may be substantially different from the investment strategy and types of securities held by your account.