
Summary
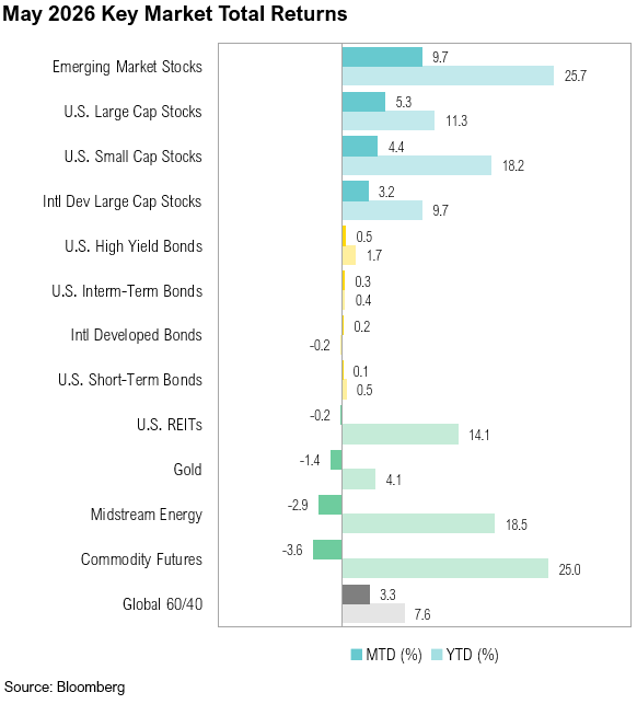
- U.S. large-cap stocks, as proxied by the S&P 500 Index, rose 5.3% in May, while U.S. small-cap stocks gained 4.4% over the month. U.S. intermediate-term bonds ended the month up 0.3%.
- The Strait of Hormuz remains the world’s most important economic bottleneck, as the U.S.-Iran conflict continues to pressure energy markets and keep fuel inventories tight.
- AI has become the market’s new bottleneck, and memory and power shortages are becoming the primary constraints on AI infrastructure growth.
- The AI investment cycle is accelerating with hyperscalers projected to spend nearly $750 billion on capital expenditures in 2026 to expand compute capacity.
- Helped by the capex boom, S&P 500 earnings growth expectations have increased dramatically across all sectors, and profit margins are expected to stay near historic highs.
Overview
U.S. large-cap stocks, as measured by the S&P 500 Index, gained 5.3%, while the small-cap Russell 2000 Index advanced 4.4%. U.S. intermediate-term bonds, proxied by the Bloomberg U.S. Aggregate Bond Index, returned 0.3%.
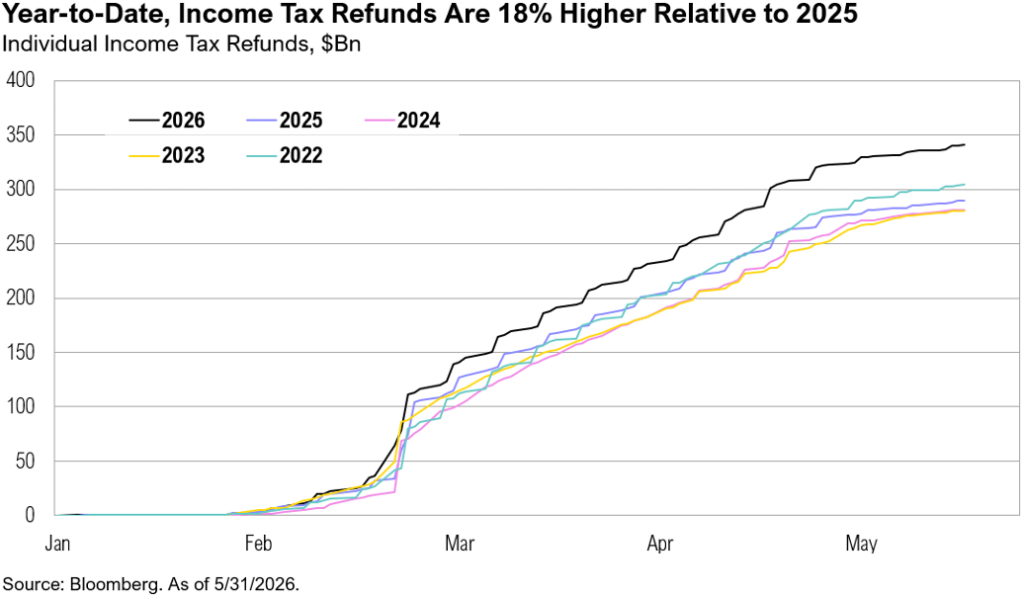
Recent U.S. economic data continued to show the resilience of the U.S. consumer. Higher-than-usual tax refunds (with the total amount refunded—$325 billion—18% higher than 2025 year-to-date) continued to support spending despite rising fuel prices.1 Per Walmart CFO John Rainey:
“I think higher tax returns muted some of the pressure related to higher fuel prices.”2
The labor market remains similarly resilient, and the U.S. economy added 172,000 new jobs in May.3 Further, job openings rose to 7.6 million in April, the highest since May 2024.4 The stronger-than-expected May jobs report increased investors’ expectations for interest rate hikes, and markets are now pricing in two 0.25% rate hikes by early 2027, a sharp reversal from the two rate cuts expected only a few months ago.5
Bottlenecks
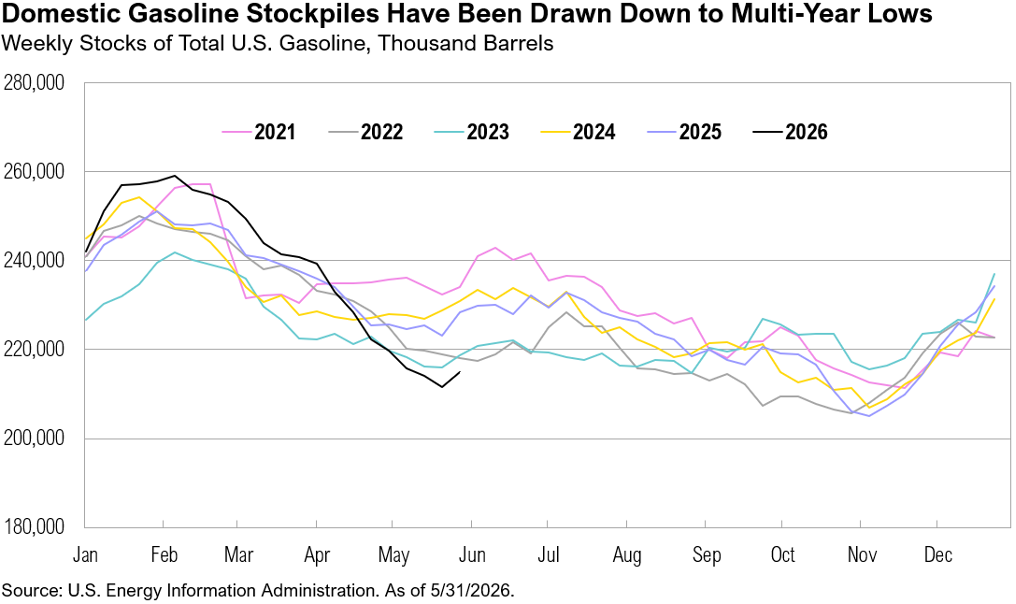
Early June marked the 100th day of the U.S.-Iran conflict. Since the war began on February 28, the conflict has shifted from direct military confrontation to a prolonged standoff over the Strait of Hormuz, keeping a critical global energy bottleneck largely closed and contributing to ongoing pressure on oil and gas markets. Oil prices remained volatile throughout May. West Texas Intermediate (WTI) crude reached $109 per barrel on May 18 (the day President Trump called off an imminent round of military strikes against Iran to allow more time for negotiations) before ending the month at $87. Brent crude followed a similar path, peaking at $112 before closing May at $92. Domestic energy markets have started to reflect the prolonged impact of the Iran conflict. U.S. gasoline inventories have fallen to multi-year lows, and average pump prices for regular unleaded gasoline have risen from $2.80 per gallon in early January to $4.32 by the end of May.6,7 On the positive side, U.S. exports of crude oil rose to a record 5.6 million barrels per day in May, serving as a tailwind to the U.S. oil and gas industry.8
Throughout April and May, several attempts at a broader agreement came close but ultimately failed. Talks in Islamabad on April 12 collapsed over disagreements around Iran’s nuclear program and stockpile of highly enriched uranium. In mid-April, efforts to use a temporary Israel–Lebanon ceasefire as a confidence-building measure broke down as military operations continued, while negotiations over reopening Hormuz stalled in May and into June as neither side was willing to remove restrictions first.9 Three issues have repeatedly derailed negotiations: Iran’s nuclear program, the standoff between the U.S. naval blockade and Iran’s restrictions on Hormuz, and ongoing Israeli military operations in Lebanon.9
The pattern intensified in early June, when two days of back-and-forth attacks pushed the region toward a resumption of full-scale war. On June 11, Trump said he had called off new military strikes on Iran, claiming a breakthrough in negotiations just hours after threatening to escalate the conflict by seizing control of Iran’s oil industry.10 According to U.S. and Iranian officials, both countries are moving closer to signing a peace deal around the G-7 meetings in mid-June.10 Betting markets currently assign a 41% probability to a permanent peace agreement by the end of June and a 77% probability by year-end.11
The S&P 500 ended May up 20% from its March 30 low, and the technology sector advanced 42%. Despite the strong rally, valuations appear less stretched than headline index performance suggests. The market cap-weighted S&P 500 index’s 12-month forward price-to-earnings ratio ended May at 21x, above its 10-year average of 19x, while the equal-weight index ended May at 17x, in line with historical norms.12 The divergence highlights how much of the market’s valuation is derived from a small group of mega-cap technology companies rather than more average companies.
Importantly, the rally in U.S. large-cap stocks has been driven by earnings growth rather than multiple expansion. Since 2024, nearly all the S&P 500’s gains have come from rising earnings, with consensus forecasting 23% earnings growth in 2026 and revenue growth across all eleven sectors, driven by information technology (28%), energy (18%), and communication services (14%).13
The technology-led earnings growth largely rests on AI compute. The supply of compute has become the sector’s bottleneck, and a primary risk to these valuations. Initially the difficulty facing AI development was a shortage of GPUs (or graphics processing units), which are specialized semiconductors designed to perform large numbers of calculations simultaneously and used today as the primary hardware to train and run AI models. The barrier once posed by the GPU shortage has now shifted to memory and power constraints, particularly in high-bandwidth memory (HBM).14,15 As memory manufacturers redirect production capacity toward AI data centers, these shortages have driven prices significantly higher and increased costs across the supply chain. Memory now accounts for as much as 35% of hardware costs, compared with a historical range of 15-18%.16
According to Dell CEO Jeffrey Clarke:
“Demand continues to exceed supply with memory as the primary constraint, and we expect to exit the year with a meaningful backlog.”17
TSMC is struggling to keep up:
“It will be a long time before we can meet customer demand. We continue to see increasing adoption of AI models across consumer, enterprise and sovereign AI applications. This trend is driving demand for greater computing power, which in turn supports strong demand for advanced semiconductors chips.”18
Per Nvidia CEO Jensen Huang:
“GPU consumption is going through the roof and even GPUs we sold four or five years ago now are rising in price faster than, you know, good wine.”19
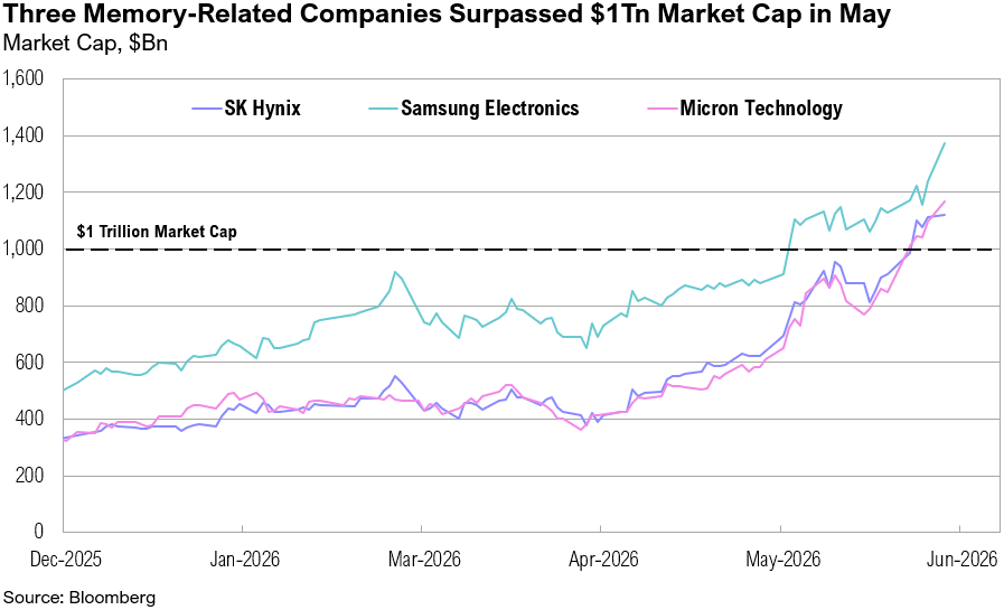
These constraints continue to support pricing power for chip and memory manufacturers while raising costs for hyperscalers and AI-dependent businesses. Increasingly, however, the effects extend beyond supply chains and into equity markets themselves. Taiwan recently overtook India as the world’s fifth-largest equity market, driven largely by Taiwan Semiconductor Manufacturing Company (TSMC), which now accounts for more than 40% of the local benchmark.20 Meanwhile, three memory-related companies—SK Hynix, Samsung, and Micron—surpassed $1 trillion market capitalizations during May. None began 2026 with valuations above $500 billion.21
The industry has responded with an unprecedented wave of investment. Global semiconductor capital expenditure is expected to approach $200 billion in 2026, and memory manufacturers account for nearly half of total spending.22,23 TSMC is projected to spend $120 billion across 2026 and 2027, more than double its combined investment over the previous two years.24 Micron is expected to spend $63 billion over the same period, nearly three times its 2024-2025 total.25
The effects are already visible in trade flows. South Korean semiconductor exports to the United States rose 670% year-over-year in April, while Taiwan’s export orders to the U.S. increased 48% in May.26,27 While this investment is intended to ease current shortages, it also represents a multi-year bet that AI demand remains strong enough to absorb a significant increase in future supply.
That conviction was reinforced during first-quarter earnings season. Market concerns earlier this year centered on the possibility of slowing AI investment. Instead, results from Alphabet, Microsoft, Amazon, and Meta suggest AI-related capital spending continues to accelerate. Collectively, these companies are projected to spend nearly as much in 2026 as they did in the previous two years combined, and their aggregate capital expenditures will approach $750 billion.28 The trade-off is that free cash flow is expected to come under increasing pressure. Current projections suggest both Amazon and Meta could generate negative free cash flow by the end of 2026.29
According to Alphabet CFO Anat Ashkenazi:
“We are investing to meet the unprecedented demand we are seeing from enterprises and consumers. For the full-year 2026, we expect our capex to be in the range of $180 billion to $190 billion. Looking further ahead to 2027, we expect a significant increase in our capex compared to 2026.”30
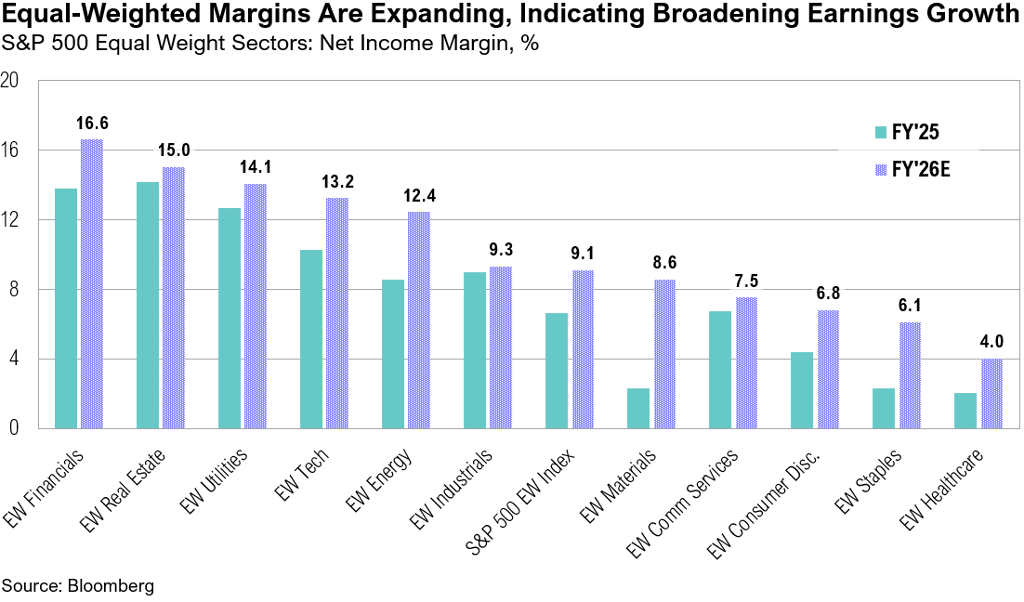
Encouragingly, earnings growth is becoming broad-based. First-quarter S&P 500 earnings growth came in at 28.8%, far surpassing the expected 13.1%.13 This strong print pushed full-year 2026 earnings growth expectations from 17% to 23%. Further, S&P 500 net profit margins expanded 13.4% in the first quarter (the highest level recorded since FactSet began tracking the metric in 2009), and margins are expected to improve across all eleven sectors during 2026.13 Consensus forecasts now call for 23% S&P 500 earnings growth next year, led by the energy sector (66%), information technology (44%), and materials (39%).13 The equal-weighted S&P 500 tells a similar story: every sector is projected to deliver 2026 net income margin growth above its respective five-year median, indicating that earnings strength is becoming increasingly broad-based rather than concentrated in mega-cap technology.31
Markets
Markets fared well in May, taking geopolitical uncertainty in their stride. Notably, emerging markets were, for the second consecutive month, the best performing of all major asset classes, ending May up 9.7%. U.S. large-cap stocks marginally outperformed small-cap counterparts, with the former gaining 5.3% and the latter ending the month up 4.4%. Developed market large-cap stocks ended the month up 3.2%. U.S. intermediate-term bonds ended May up 0.3%. Gold prices declined 1.4% in May.
Looking Forward
Looking ahead, the key question is whether today’s bottlenecks begin to ease or simply shift. The next test is whether the AI capex boom can be monetized in a way that proves profitable for hyperscalers and productivity-enhancing for the broader economy. That would help justify a backdrop in which S&P 500 earnings are expected to grow more than 20% in 2026 and margins are projected to improve materially across every sector.
Investors will also be watching Kevin Warsh’s first meeting as Fed Chair, where any inclination to cut interest rates will have to contend with resilient growth and above-target inflation. At the same time, a reopening IPO market will be worth watching as part of a gradually changing supply backdrop for U.S. large cap stocks, with a growing pipeline that now includes SpaceX, OpenAI, and Anthropic, among others. That may become more relevant as post-IPO unlock windows approach and if the hyperscalers continue to prioritize AI investment over buybacks.
Performance Disclosures
All market pricing and performance data from Bloomberg, unless otherwise cited. Asset class and sector performance are gross of fees unless otherwise indicated.
Citations
- IRS: https://www.irs.gov/newsroom/filing-season-statistics-for-week-ending-may-8-2026
- CNBC: https://www.cnbc.com/2026/06/01/q1-2026-retail-earnings-tax-refunds-bnpl.html
- Bureau of Labor Statistics: https://www.bls.gov/news.release/pdf/empsit.pdf
- Bureau of Labor Statistics: https://www.bls.gov/news.release/jolts.nr0.htm
- CME FedWatch: https://www.cmegroup.com/markets/interest-rates/cme-fedwatch-tool.html
- U.S. Energy Information Administration: https://www.eia.gov/petroleum/weekly/gasoline.php
- AAA: https://gasprices.aaa.com/
- U.S. Energy Information Administration: https://www.eia.gov/dnav/pet/hist/LeafHandler.ashx?n=PET&s=WCREXUS2&f=W
- Al Jazeera: https://www.aljazeera.com/news/2026/6/7/how-many-times-were-the-us-and-iran-on-the-verge-of-a-deal
- Wall Street Journal: https://www.wsj.com/world/middle-east/trump-iran-strikes-peace-talks-38996e77
- Polymarket: https://polymarket.com/event/us-x-iran-permanent-peace-deal-by
- Bloomberg data series
- FactSet: https://advantage.factset.com/hubfs/Website/Resources%20Section/Research%20Desk/Earnings%20Insight/EarningsInsight_060526.pdf
- GlobalX: https://www.globalxetfs.com/articles/memory-is-the-new-bottleneck-in-ai-semiconductors
- Scientific American: https://www.scientificamerican.com/article/high-bandwidth-memory-is-a-bottleneck-for-ai-chips/
- Bloomberg: https://www.bloomberg.com/graphics/2026-ai-boom-memory-chip-shortage/
- Dell Technologies: https://investors.delltechnologies.com/static-files/b63ffff9-b729-403b-a231-c6af05667759
- The Transcript: https://thetranscript.substack.com/p/06-08-2026-staying-out-of-the-rough
- Seeking Alpha: https://seekingalpha.com/article/4900133-agentic-ai-is-great-for-aws
- Bloomberg: https://www.bloomberg.com/news/articles/2026-05-26/tsmc-s-relentless-rise-powers-taiwan-s-market-value-above-india
- Bloomberg data series
- Deloitte: https://www.deloitte.com/us/en/insights/industry/technology/technology-media-telecom-outlooks/semiconductor-industry-outlook.html
- PwC: https://www.pwc.com/gx/en/industries/technology/pwc-semiconductor-and-beyond-2026-full-report.pdf
- Bloomberg data series
- Bloomberg data series
- Tech Times: https://www.techtimes.com/articles/316601/20260514/south-koreas-ict-exports-hit-all-time-growth-rate-1259-april-driven-ai-server-chip-demand.htm
- Reuters: https://www.reuters.com/world/asia-pacific/taiwan-may-exports-hit-second-highest-value-by-month-strong-ai-demand-2026-06-09/
- Bloomberg: https://www.bloomberg.com/news/articles/2026-04-30/us-big-tech-ratchets-up-ai-spending-past-700-billion-this-year
- Bloomberg data series
- Alphabet: https://blog.google/alphabet/investor-presentation-june-2026/
- Bloomberg data series
Index Definitions
The S&P 500 Index is widely regarded as the best single gauge of the United States equity market. It includes 500 leading companies in leading industries of the U.S. economy. The S&P 500 focuses on the large cap segment of the market and covers approximately 75% of U.S. equities.
The S&P 500 Equal Weight Index (EWI) is the equal-weight version of the widely-used S&P 500. The index includes the same constituents as the capitalization weighted S&P 500, but each company in the S&P 500 EWI is allocated a fixed weight – or 0.2% of the index total at each quarterly rebalance.The S&P 500® Equal Weight Index (EWI) is the equal-weight version of the widely-used S&P 500. The index includes the same constituents as the capitalization weighted S&P 500, but each company in the S&P 500 EWI is allocated a fixed weight – or 0.2% of the index total at each quarterly rebalance.
The Bloomberg Barclays U.S. Aggregate Index represents securities that are SEC-registered, taxable, and dollar denominated. The index covers the U.S. investment grade fixed rate bond market, with index components for government and corporate securities, mortgage pass-through securities, and asset-backed securities. Duration is roughly 5 years.
The Bloomberg U.S. Corporate High Yield Bond Index measures the USD-denominated, high yield, fixed-rate corporate bond market. Securities are classified as high yield if the middle rating of Moody’s, Fitch and S&P is Ba1/BB+/BB+ or below. Bonds from issuers with an emerging markets country of risk, based on the indices’ EM country definition, are excluded.
The Russell 2000® Index measures the performance of the small-cap segment of the US equity universe. It includes approximately 2000 of the smallest US equity securities in the Russell 3000 Index based on a combination of market capitalization and current index membership. The Russell 2000 Index represents approximately 10% of the total market capitalization of the Russell 3000 Index. Because the Russell 2000 serves as a proxy for lower quality, small cap stocks, it provides an appropriate benchmark for RMB Special Situations.
The U.S. Dollar Index is used to measure the value of the dollar against a basket of six foreign currencies: the euro, Swiss franc, Japanese yen, Canadian dollar, British pound, and Swedish krona.
MSCI U.S. REIT Index is a free float-adjusted market capitalization weighted index that is comprised of equity Real Estate Investment Trusts (REITs). The index is based on the MSCI USA Investable Market Index (IMI), its parent index, which captures the large, mid and small cap segments of the USA market. With 150 constituents, it represents about 99% of the US REIT universe and securities are classified under the Equity REITs Industry (under the Real Estate Sector) according to the Global Industry Classification Standard (GICS®), have core real estate exposure (i.e., only selected Specialized REITs are eligible) and carry REIT tax status.
Disclaimers
*Source: MSCI.MSCI makes no express or implied warranties or representations and shall have no liability whatsoever with respect to any MSCI data contained herein. The MSCI data may not be further redistributed or used as a basis for other indexes or any securities or financial products. This report is not approved, endorsed, reviewed or produced by MSCI. None of the MSCI data is intended to constitute investment advice or a recommendation to make (or refrain from making) any kind of investment decision and may not be relied on as such.
The opinions and analyses expressed in this newsletter are based on Curi Capital, LLC’s (“Curi Capital”) research and professional experience are expressed as of the date of our mailing of this newsletter. Certain information expressed represents an assessment at a specific point in time and is not intended to be a forecast or guarantee of future results, nor is it intended to speak to any future time periods. Curi Capital makes no warranty or representation, express or implied, nor does Curi Capital accept any liability, with respect to the information and data set forth herein, and Curi Capital specifically disclaims any duty to update any of the information and data contained in this newsletter. The information and data in this newsletter does not constitute legal, tax, accounting, investment or other professional advice. Returns are presented net of fees. An investment cannot be made directly in an index. The index data assumes reinvestment of all income and does not bear fees, taxes, or transaction costs. The investment strategy and types of securities held by the comparison index may be substantially different from the investment strategy and types of securities held by your account.