
Summary
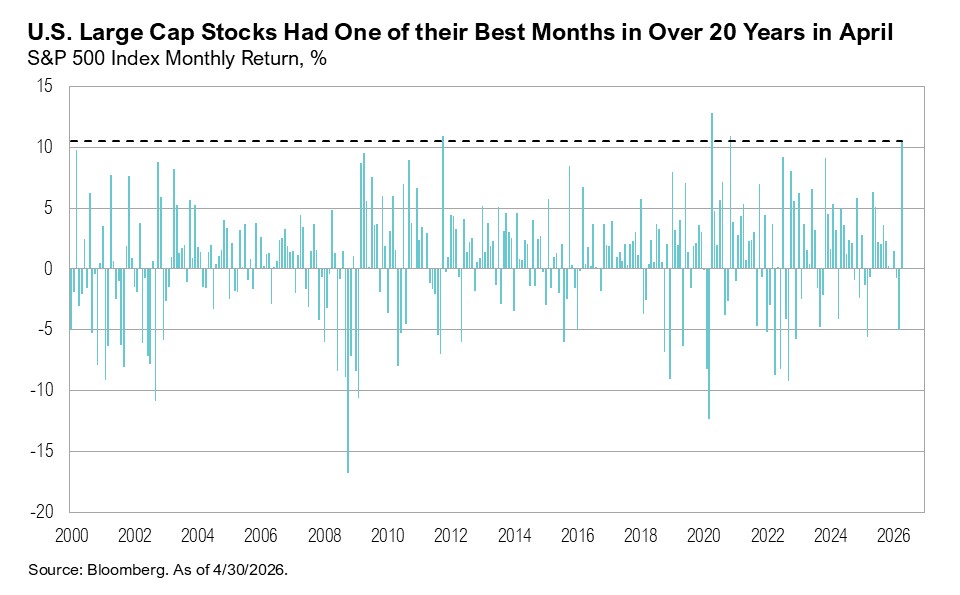
- Despite continued geopolitical uncertainty, U.S. large-cap stocks, as proxied by the S&P 500 Index, rose 11% in April, making it the fourth-best month since January 2000. U.S. small-cap stocks gained 12% over the month.
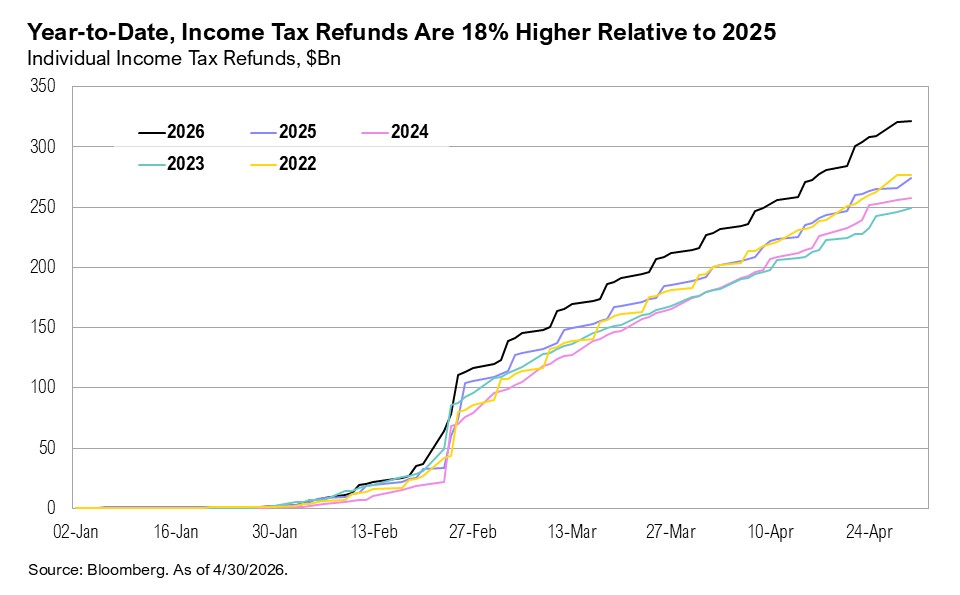
- The U.S. consumer remains resilient, bolstered by higher tax refunds. Personal spending rose 0.9% in March.
- Kevin Warsh is expected to take over as Federal Reserve Chair in mid-May, at a time when markets are no longer pricing interest rate cuts in 2026.
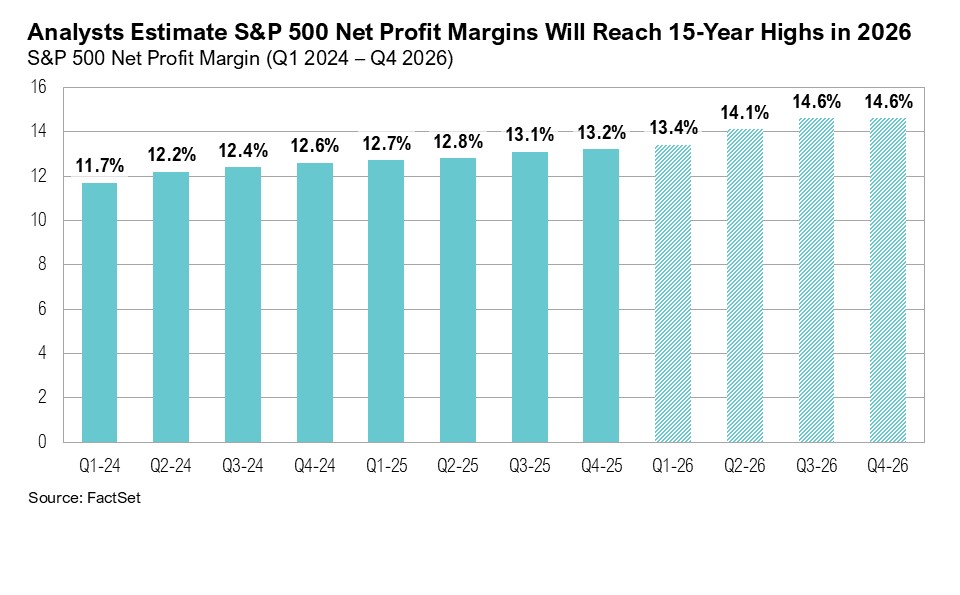
- Corporate profit margins are tracking at a 15-year high, while first quarter earnings growth for the S&P 500 has been revised upwards to 27%.
- We believe that energy prices, driven by geopolitical disruption, may be the key swing factor for markets. If they don’t stabilize, we would expect further divergence between sectors and countries that are overly reliant on imported oil.
Overview
Despite continued geopolitical uncertainty U.S. large-cap stocks, represented by the S&P 500 Index, rose 11%, achieving the fourth-best month since January 2000. The small-cap Russell 2000 Index gained an impressive 12%. U.S. intermediate-term bonds, proxied by the Bloomberg U.S. Aggregate Bond Index, were essentially flat, up 0.1%.
Recent U.S. economic data has highlighted the resilience of the U.S. consumer. Higher-than-usual tax refunds (with the total amount refunded—$313 billion—18% higher than 2025 year-to-date) supported spending, despite rising fuel prices.1 Personal spending increased by 0.9% in March, marking the highest monthly print in at least three years.2 The personal saving rate declined to 3.6% in March, marking the lowest reading since November 2022.3
As expected, the Federal Reserve held rates steady at its April 29 Federal Open Market Committee meeting, and the policy rate has remained unchanged at 3.50%–3.75% since December 2025. The meeting marked the final one chaired by Jerome Powell, who will remain a voting governor for the foreseeable future. Powell’s term ends in January 2028, but he has not yet confirmed how long he will stay.4 The Department of Justice dropped its investigation into Powell on April 24, clearing a key obstacle to Kevin Warsh’s confirmation. Senator Thom Thillis ultimately provided the deciding vote, and Warsh is expected to begin his four-year term on May 15, pending final Senate approval.5
Kevin Warsh appeared before the Senate Banking Committee on April 21. At the hearing, Warsh outlined three priorities: refocusing the Fed on its dual mandate, adopting a new metric to measure inflation, and reducing reliance on tools such as quantitative easing and forward guidance.6 He emphasized trimmed-mean inflation, which excludes extreme price moves each period to better capture underlying trends.7 This is consistent with past Fed practice. Different regimes have shifted preferred metrics over time, from CPI under Arthur Burns and Paul Volcker, to PCE under Alan Greenspan, and more recently references to “supercore” PCE under Powell, which excludes housing.8 Warsh described AI as “the most productivity-enhancing wave of our lifetimes” and indicated that technology developments could exert downward pressure on inflation.9 If AI does meaningfully boost productivity, it may act as a disinflationary force, creating room for lower interest rates—or at least reducing the need for further hikes. He noted, “The Fed needs to get access to better data and to dig deeper into the productivity possibilities.” Despite the transition to a new chair, particularly one who has recently made clear his preference for lower interest rates, markets are not pricing in any rate changes in 2026.10
Houston, Do We Have a Problem?
On April 1, NASA’s Artemis II mission launched from the Kennedy Space Center and successfully splashed down in the Pacific Ocean on April 10, marking the first human crew to orbit the moon since the Apollo 13 mission in 1970. At their farthest point, the Artemis crew traveled 252,756 miles from Earth, breaking the deep-space record held by the Apollo 13 astronauts for over 50 years.11
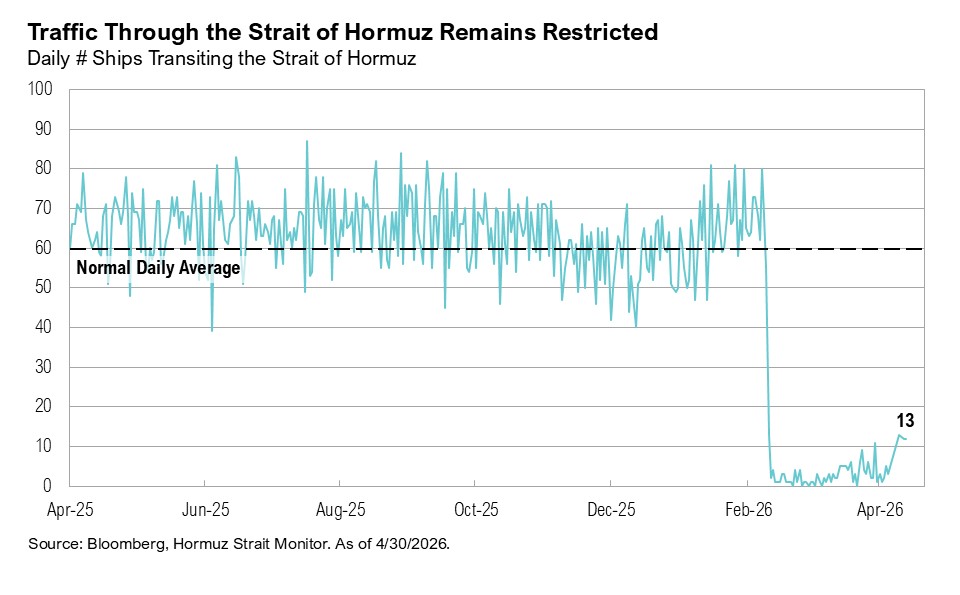
The phrase “Houston, we have a problem” was coined on April 14, 1970, when an oxygen tank ruptured aboard Apollo 13 roughly 20,000 miles from earth.12 Exactly 56 years later (to the month) the phrase fits again. The failure this time isn’t an oxygen tank deep in space, but rather oil tankers roughly 7,000 miles from Texas in the Strait of Hormuz. For two months, traffic through the Strait of Hormuz, which handles roughly 20% of global oil and 25% of global LNG on a daily basis, has been restricted, and now only about 8% of normal daily volumes pass through.13
On February 28, a coordinated strike by U.S. and Israeli forces targeted Iran’s leadership, military command centers, air defense systems, missile launch sites, naval facilities, and elements of its nuclear and missile infrastructure. Iran retaliated with a series of missile and drone attacks across the region, including strikes on Gulf energy infrastructure across Qatar, Saudi Arabia, the United Arab Emirates, and Bahrain.14 The conflict led to a de facto closure of the Strait of Hormuz, severely constraining global oil flows. The U.S. Energy Information Administration (EIA) has estimated that around 9 million barrels of oil per day have been shut in (crude production that is temporarily halted or unable to reach market due to operational, logistical, or geopolitical disruptions).15
Throughout April, markets adjusted their timeline for the conflict. The December 2026 price per barrel of Brent crude (the seaborne crude oil global benchmark and most exposed to disruptions in the Strait of Hormuz) rose from $78 on April 1 to $88 on April 30. At the same time, the gap between Brent prices and West Texas Intermediate crude (or WTI, which is inland and less exposed to global price fluctuations) ended April at the widest level since the start of the conflict. Under normal circumstances, the gap would shrink if the disruption were temporary (or viewed as such), and the move throughout April indicates markets are increasingly doubtful about a lasting ceasefire and peace resolution, instead pricing in continued disruption through the end of 2026. By early May, markets had reversed much of the April moves on reports that the U.S. and Iran were making progress on a memorandum of understanding that would lead to a final resolution of the conflict.16 Iran reportedly proposed opening the Strait of Hormuz and ending the U.S. Naval blockade first, but the issue of its nuclear program lingers. WTI crude prices dropped to $95 on May 8, and December prices eased from a high of $84 to $79, while Brent crude prices dropped to $101. December Brent prices dropped from a high of $91 on May 4 to $87 on May 8.
Despite the U.S. being more energy dependent than at any other time in its history, the pass-through to consumers is building. Energy accounts for between 7% and 8% of inflation, and it has further indirect effects on inflation via transportation, logistics, and production costs, creating broader but more gradual second-round inflationary pressures across goods and services.17 National average gas prices ended April at $4.40 per gallon, the highest since July 2022.18 Jet fuel, which represents between 20% and 35% of an airline’s operating expenses, has roughly doubled.19 United Airlines has cut its schedule by around 5% through September, trimming lower-margin routes, while Delta Air Lines has reduced routes from JFK, Detroit, and Boston.20,21 U.S. airlines have reported that they will need to pass higher fuel costs to customers via fares and fees and may reduce capacity, though cuts remain less severe than in Europe and Asia.21,22 Many European and Asian economies are much more dependent on foreign energy than the U.S. For example, Japan imports nearly 90% of its oil from the Middle East, and Germany produces almost no energy domestically, with around 98% of its energy sources imported.23,24 The longer the conflict plays out, the greater the risk to global growth, especially oil-dependent sectors and economies.
Meanwhile, U.S. corporate fundamentals remain strong. Over 60% of companies in the S&P 500 have reported first-quarter 2026 earnings results, and net profit margins are on track for a 15-year high of 13.4% and are expected to rise to 14.6% by year-end.25,26 As earnings season has progressed, growth expectations for the first quarter have jumped from 13% at the end of March to 27% by the end of April—the fastest pace since 2021.26 Earnings growth expectations for 2026 rose from 17% to 21% over the month, with the energy (45%), information technology (39%) and materials (36%) sectors expected to be the top contributors.26
Four of the Magnificent Seven reported first-quarter earnings on April 29, showing mixed results that highlighted both strong growth and rising investment pressure. Meta fell 10% after raising capital expenditure guidance by $10 billion, underscoring an urgent push to secure compute capacity. It also announced plans to cut 10% of its workforce to offset heavy AI spending.27 In contrast, Alphabet rose 7% on strong cloud performance and early TPU (Tensor Processing Unit, a custom-built chip designed to process AI and machine learning tasks much faster and more efficiently than a regular chip) monetization, while Amazon gained 4% as web services grew 28% year-over-year and delivered its largest fourth-quarter to first-quarter revenue increase on record.28,29 Microsoft shares slipped 4%, reflecting elevated AI investment and pressures in its core software business.30 Earlier in April, Microsoft offered voluntary retirement to 7% of its U.S. workforce.31 Amazon, Alphabet, Meta, and Microsoft are each projected to spend more than $700 billion in 2026 on capex, more than the prior two years combined.32 On the back of Alphabet’s and Meta’s results, the communication services sector experienced revised first-quarter earnings expectations of -4% to 53%.26 Similarly, consumer discretionary earnings expectations jumped from 2% to 39%, driven by Amazon.26
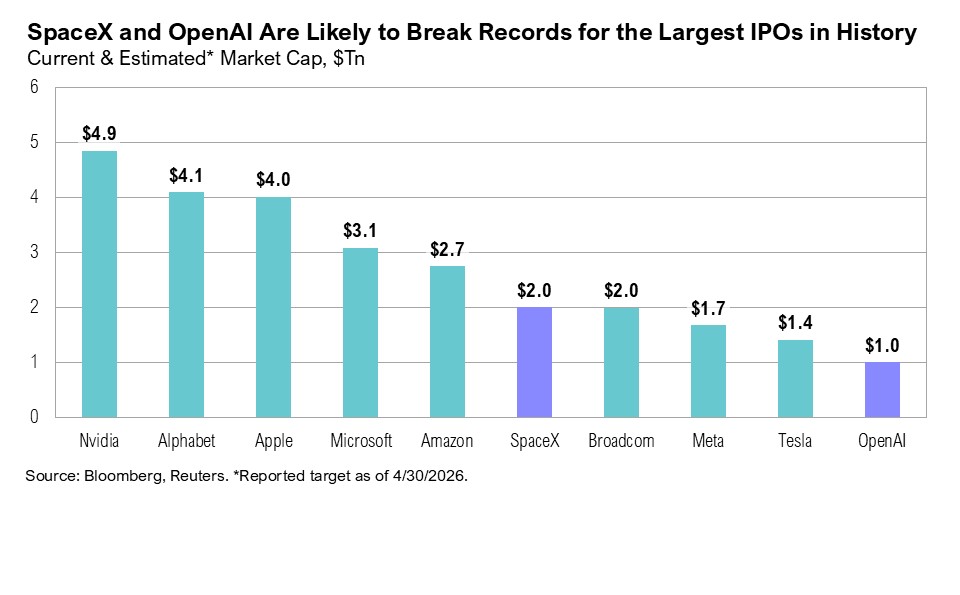
There are now over 1,700 unicorns (private companies worth more than $1 billion) globally.33 Six of the 10 most valuable unicorns are based in the U.S., and the top two, SpaceX and OpenAI, are planning to go public. With an estimated market cap of $2 trillion and $1 trillion respectively, SpaceX will likely break records for the largest initial public offerings in history, a record currently held by Saudi Aramco, which listed in December 2019 with a market cap of $1.7 trillion.34,35,36 SpaceX is reportedly targeting a June 2026 listing. The S&P 500 Index and Nasdaq are both considering concessions, such as waiving the typical seasoning period, to accelerate its inclusion in their indices.37 Nasdaq is also reportedly planning to allocate up to 30% of shares to retail investors—well above the norm—reflecting Elon Musk’s “fan-friendly” approach.38 OpenAI has not confirmed timing but is widely expected to be listed in late 2026 or 2027.39
Markets
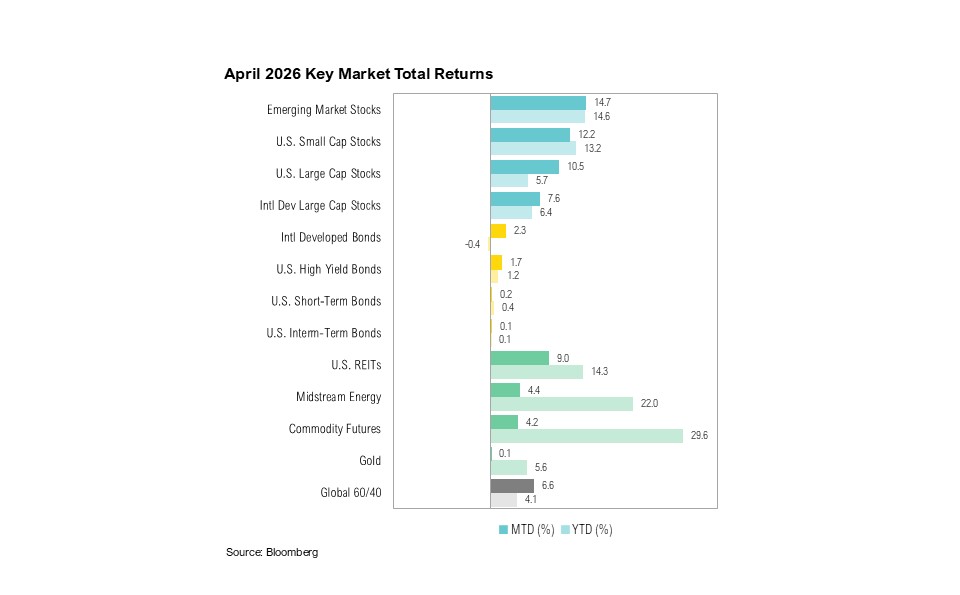
Despite ongoing geopolitical uncertainty, markets fared well in April. Notably, emerging markets were the best performing of all major asset classes, ending the month up 14.7%. U.S. small-cap stocks gained a notable 12%, marginally outperforming large-cap peers, which ended the month up 10.5%. Developed market large-cap stocks ended the month up 7.6%. U.S. intermediate-term bonds ended April flat, up 0.1%. Gold prices gained only 0.1% in April but are still up nearly 6% year-to-date.
Looking Forward
By early May, reports suggested that the U.S. and Iran were making progress toward a comprehensive agreement that would end the conflict. (President Trump did, yet again, threaten escalation if an agreement cannot be reached.)40 The future of Iran’s nuclear program and control over the Strait of Hormuz remain key sticking points in negotiations. By the end of the first week of May, no further progress had been made.
Some markets are flying high, but the fuel gauge is one of the key things to watch. If oil stays elevated, second-order effects such as fertilizer, fuel, freight, and logistics costs could broaden inflation and eventually feed into food and goods prices. For now, current signals still point to a resilient U.S. economy, supported by strong corporate earnings and continued AI investment.
Performance Disclosures
All market pricing and performance data from Bloomberg, unless otherwise cited. Asset class and sector performance are gross of fees unless otherwise indicated.
Citations
- IRS: https://www.irs.gov/newsroom/filing-season-statistics-for-week-ending-april-24-2026
- Bureau of Economic Analysis: https://www.bea.gov/data/consumer-spending/main
- Federal Reserve Bank of St. Louis: https://fred.stlouisfed.org/series/PSAVERT
- Wall Street Journal: https://www.wsj.com/economy/central-banking/jerome-powell-federal-reserve-decision-89f4ff22
- CNBC: https://www.cnbc.com/2026/04/24/fed-powell-doj-warsh-trump.html
- United States Senate Committee on Banking, Housing, and Urban Affairs: https://www.banking.senate.gov/hearings/04/14/2026/nomination-hearing
- Reuters: https://www.reuters.com/markets/us/warshs-quest-better-inflation-data-is-well-worn-difficult-pursuit-fed-2026-04-24/
- CME Group: https://www.cmegroup.com/openmarkets/equity-index/2025/Why-the-Fed-Prefers-PCE-Over-CPI-for-Inflation-Insights.html
- Charles Schwab: https://www.schwab.com/learn/story/fed-watch-can-ai-productivity-gain-cut-inflation
- CME FedWatch: https://www.cmegroup.com/markets/interest-rates/cme-fedwatch-tool.html
- NASA: https://www.nasa.gov/news-release/nasa-welcomes-record-setting-artemis-ii-moonfarers-back-to-earth/
- NASA: https://www.nasa.gov/history/houston-weve-had-a-problem/
- Hormuz Strait Monitor: https://hormuzstraitmonitor.com/
- Reuters: https://www.reuters.com/business/aerospace-defense/top-us-general-outlines-initial-timeline-us-military-operation-iran-2026-03-02/
- U.S. Energy Information Administration: https://www.eia.gov/outlooks/steo/
- Axios: https://www.axios.com/2026/05/06/iran-us-deal-one-page-memo
- Bureau of Labor Statistics: https://www.bls.gov/cpi/tables/relative-importance/2025.htm
- AAA: https://gasprices.aaa.com/
- IATA: https://www.iata.org/en/publications/economics/fuel-monitor/
- Travel Market Report: https://www.travelmarketreport.com/air/articles/delta-air-lines-cuts-routes-out-of-new-york-boston-and-more-for-summer
- Flight Global: https://www.flightglobal.com/archive/2026/04/big-four-us-airlines-cut-flights-and-raise-fares-as-fuel-shocks-squeeze-profits/
- Reuters: https://www.reuters.com/business/aerospace-defense/airlines-face-fare-dilemma-fuel-spike-threatens-travel-demand-2026-03-30/
- IEA: https://www.iea.org/data-and-statistics/data-tools/reliance-on-middle-east-oil-and-gas-supplies-by-country
- World Bank: https://data.worldbank.org/indicator/EG.IMP.CONS.ZS?locations=DE
- FactSet: https://advantage.factset.com/hubfs/Website/Resources%20Section/Research%20Desk/Earnings%20Insight/EarningsInsight_042426.pdf
- FactSet: https://advantage.factset.com/hubfs/Website/Resources%20Section/Research%20Desk/Earnings%20Insight/EarningsInsight_050126.pdf
- CNBC: https://www.cnbc.com/2026/04/29/meta-q1-earnings-report-2026.html
- Reuters: https://www.reuters.com/business/alphabets-cloud-unit-beats-quarterly-revenue-estimates-strong-ai-demand-2026-04-29/
- CNBC: https://www.cnbc.com/2026/04/29/amazon-amzn-q1-earnings-report-2026.html
- CNBC: https://www.cnbc.com/2026/04/29/microsoft-msft-q3-earnings-report-2026.html
- Wall Street Journal: https://www.wsj.com/tech/microsoft-offers-buyouts-to-7-of-workforce-755b8534
- Bloomberg: https://www.bloomberg.com/news/articles/2026-04-30/us-big-tech-ratchets-up-ai-spending-past-700-billion-this-year
- BestBrokers: https://www.bestbrokers.com/forex-brokers/most-valuable-unicorn-startups/
- Bloomberg: https://www.bloomberg.com/news/articles/2026-04-02/spacex-is-said-to-target-more-than-2-trillion-valuation-in-ipo
- Bloomberg: https://www.bloomberg.com/news/articles/2025-10-29/openai-could-target-1-trillion-value-in-ipo-reuters-says
- Wall Street Journal: https://www.wsj.com/articles/aramco-shares-rise-10-after-worlds-biggest-ipo-11576050635
- Wall Street Journal: https://www.wsj.com/finance/stocks/stock-indexes-are-contorting-themselves-to-include-spacex-and-openai-92136b13
- Reuters: https://www.reuters.com/business/finance/musk-rewrites-ipo-playbook-with-large-slice-spacex-stock-retail-investors-source-2026-03-26/
- Reuters: https://www.reuters.com/business/openai-lays-groundwork-juggernaut-ipo-up-1-trillion-valuation-2025-10-29/
- Axios: https://www.axios.com/2026/05/06/trump-iran-war-deal-framework-response
Index Definitions
The S&P 500 Index is widely regarded as the best single gauge of the United States equity market. It includes 500 leading companies in leading industries of the U.S. economy. The S&P 500 focuses on the large cap segment of the market and covers approximately 75% of U.S. equities.
The Bloomberg Barclays U.S. Aggregate Index represents securities that are SEC-registered, taxable, and dollar denominated. The index covers the U.S. investment grade fixed rate bond market, with index components for government and corporate securities, mortgage pass-through securities, and asset-backed securities. Duration is roughly 5 years.
The Bloomberg U.S. Corporate High Yield Bond Index measures the USD-denominated, high yield, fixed-rate corporate bond market. Securities are classified as high yield if the middle rating of Moody’s, Fitch and S&P is Ba1/BB+/BB+ or below. Bonds from issuers with an emerging markets country of risk, based on the indices’ EM country definition, are excluded.
The Russell 2000® Index measures the performance of the small-cap segment of the US equity universe. It includes approximately 2000 of the smallest US equity securities in the Russell 3000 Index based on a combination of market capitalization and current index membership. The Russell 2000 Index represents approximately 10% of the total market capitalization of the Russell 3000 Index. Because the Russell 2000 serves as a proxy for lower quality, small cap stocks, it provides an appropriate benchmark for RMB Special Situations.
The U.S. Dollar Index is used to measure the value of the dollar against a basket of six foreign currencies: the euro, Swiss franc, Japanese yen, Canadian dollar, British pound, and Swedish krona.
MSCI U.S. REIT Index is a free float-adjusted market capitalization weighted index that is comprised of equity Real Estate Investment Trusts (REITs). The index is based on the MSCI USA Investable Market Index (IMI), its parent index, which captures the large, mid and small cap segments of the USA market. With 150 constituents, it represents about 99% of the US REIT universe and securities are classified under the Equity REITs Industry (under the Real Estate Sector) according to the Global Industry Classification Standard (GICS®), have core real estate exposure (i.e., only selected Specialized REITs are eligible) and carry REIT tax status.
Disclaimers
*Source: MSCI.MSCI makes no express or implied warranties or representations and shall have no liability whatsoever with respect to any MSCI data contained herein. The MSCI data may not be further redistributed or used as a basis for other indexes or any securities or financial products. This report is not approved, endorsed, reviewed or produced by MSCI. None of the MSCI data is intended to constitute investment advice or a recommendation to make (or refrain from making) any kind of investment decision and may not be relied on as such.
The opinions and analyses expressed in this newsletter are based on Curi Capital, LLC’s (“Curi Capital”) research and professional experience are expressed as of the date of our mailing of this newsletter. Certain information expressed represents an assessment at a specific point in time and is not intended to be a forecast or guarantee of future results, nor is it intended to speak to any future time periods. Curi Capital makes no warranty or representation, express or implied, nor does Curi Capital accept any liability, with respect to the information and data set forth herein, and Curi Capital specifically disclaims any duty to update any of the information and data contained in this newsletter. The information and data in this newsletter does not constitute legal, tax, accounting, investment or other professional advice. Returns are presented net of fees. An investment cannot be made directly in an index. The index data assumes reinvestment of all income and does not bear fees, taxes, or transaction costs. The investment strategy and types of securities held by the comparison index may be substantially different from the investment strategy and types of securities held by your account.