
Summary
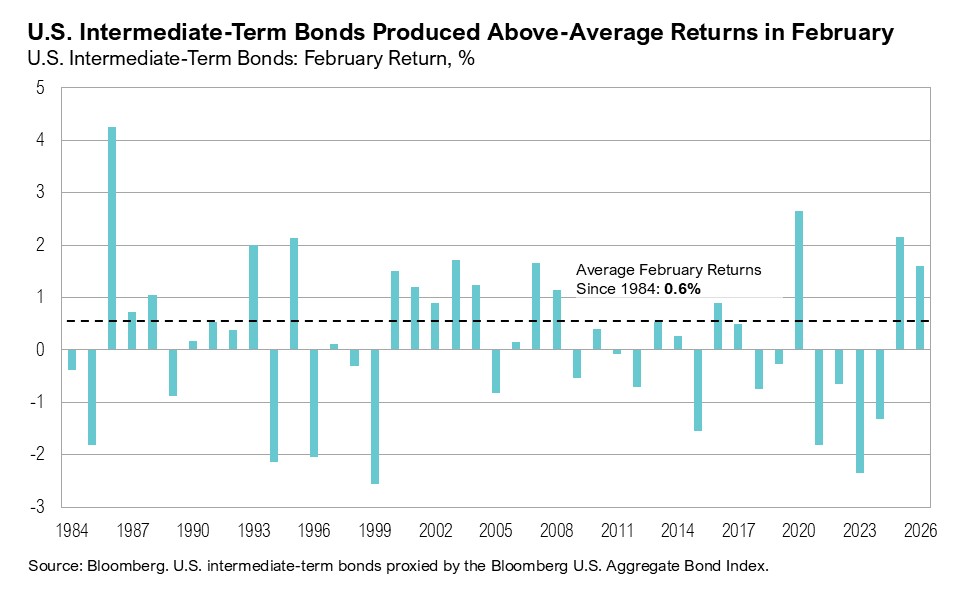
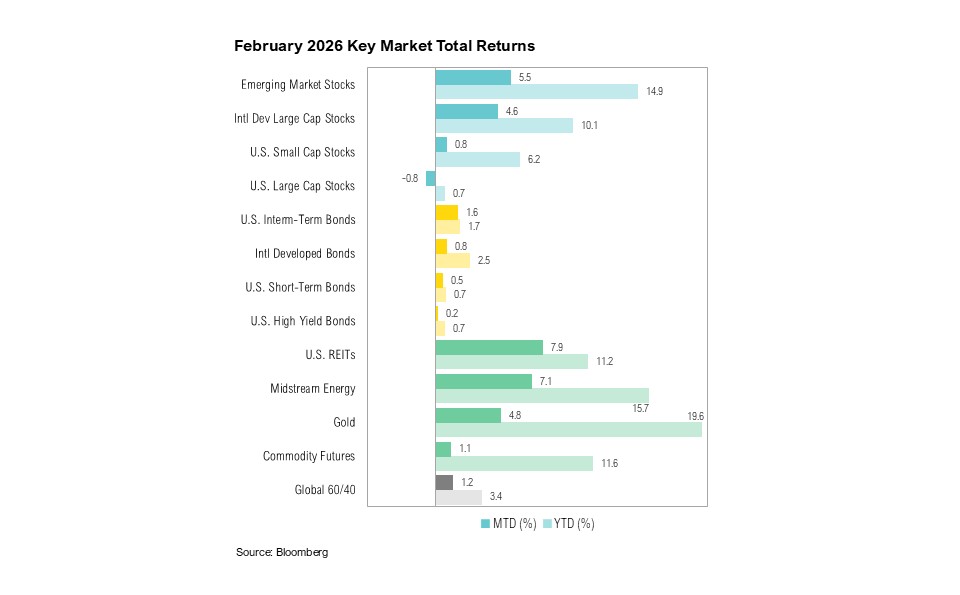
- U.S. large-cap stocks declined by 0.8% in February, while U.S. small-cap stocks gained 0.8%. U.S. intermediate-term bonds fared well, rising 1.6%.
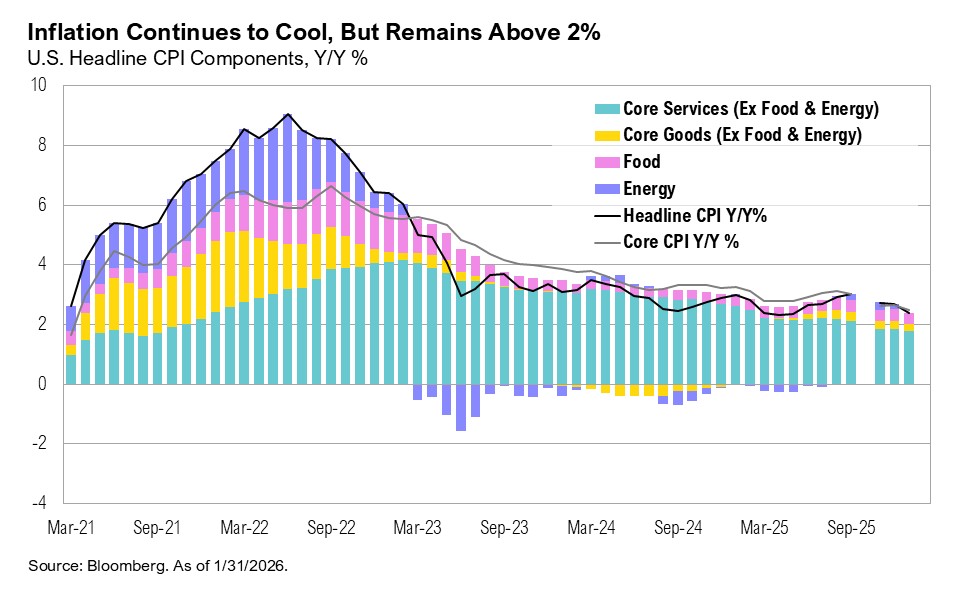
- Headline inflation eased to 2.4% year over year, as energy and shelter costs moderated and January payrolls exceeded expectations.
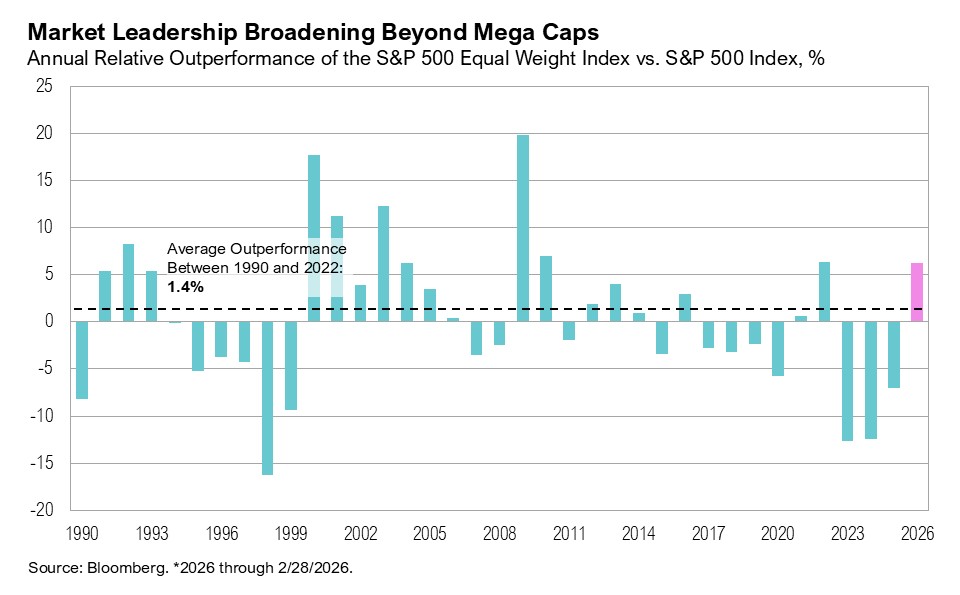
- The equal-weight S&P 500 rose 2.9%, outperforming the cap-weighted index, as value stocks and energy, materials, and consumer staples led the market, while technology lagged.
- The technology sector faced concerns over AI-related capital spending along with growing fears that AI agents will materially disrupt traditional software companies.
- A U.S.–Israeli strike in Iran, regional retaliation, and the effective closure of the Strait of Hormuz pushed oil prices up 20% and sent equities lower.
Overview
Markets delivered mixed results in February. U.S. large-cap stocks, proxied by the S&P 500 Index, declined by 0.8%. U.S. small-cap stocks, as measured by the Russell 2000 Index, gained 0.8%. U.S. intermediate-term bonds, as represented by the Bloomberg U.S. Aggregate Bond Index, gained 1.6%, making it the third-best February for bonds since 2007 (behind 2020 at 2.7% and 2025 at 2.2%).
U.S. economic data over the past month painted a broadly constructive picture, and several high-profile companies used the phrase “pretty good” to describe the current macroeconomic environment. Per Citizens Financial Chair of Commercial Banking, Donald McCree:
“We’ve got a pretty good economy. We’ve got a pretty good regulatory environment. We’re got a pretty good trajectory on interest rates…”1
And Bank of America CEO Brian Moynihan said: “… People feel pretty good.”2
Inflation continued to ease in January. Headline inflation rose 2.4% year over year, and core inflation rose 2.5% year over year, marking the smallest annual increase in core prices since the spring of 2021.3 A 1.5% month-over-month drop in energy prices (led by gasoline and fuel oil) drove much of the improvement.4 Shelter costs increased by just 0.2% month over month, which is a relatively soft reading compared to recent years.4
The labor market remains resilient. The U.S. economy added 130,000 new jobs in January, nearly double the surveyed expectations of 65,000.5 However, the final benchmark revision to 2025 payrolls showed a sizeable downward adjustment of 862,000 jobs, the largest since 2009.5
Initial fourth-quarter GDP (delayed by the October–November 2025 government shutdown) came in at 1.4% annualized, well below the 2.8% consensus estimate, largely due to a pullback in federal spending.6 The fiscal deficit remains elevated at $697 billion through the first four months of fiscal 2026.7 While down from $840 billion a year ago, it is still the largest since 2021. The improvement has been driven in part by $290 billion in tariff revenue collected since April 2025 under the “Liberation Day” measures.8 That revenue stream is now uncertain. On February 20, the Supreme Court struck down the administration’s tariffs, ruling they exceeded authority under the International Emergency Economic Powers Act.9 The administration responded by invoking Section 122 of the Trade Act of 1974, which permits temporary tariffs of up to 15% for 150 days to address balance-of-payments concerns.10 A 10% blanket tariff was imposed and later raised to 15%, keeping tariff rates elevated but extending the uncertainty surrounding trade policy.
Market Rotation
Much like a figure skater executing a triple salchow at the Winter Olympics, markets pivoted in February. The S&P 500 Equal Weight Index (which assigns each company the same weight rather than weighting by market cap) gained 2.9% in February, closing the month at a new all-time high and outpacing the market-cap-weighted S&P 500, which declined by 0.8%.
Historically, until 2023, the S&P 500 equal-weight index outperformed the market-cap-weighted index by about 1.4% annually. That pattern reversed in recent years as mega-cap technology stocks (the “Magnificent 7” group of companies comprising Apple, Amazon, Alphabet, Meta, Microsoft, Nvidia, and Tesla) drove an increasingly concentrated rally.11 February’s equal-weight outperformance suggests that leadership is beginning to broaden beyond these mega-cap names. 60% of S&P 500 constituents outperformed the index over the past month, compared to just 25% over the past six months and 21% over the past year.12
Rotation was also evident across style factors. The Russell 1000 Value Index (which tracks large-cap companies with lower valuations and more mature earnings profiles) gained 1.8% in February and is up 8.7% year to date. In contrast, the Russell 1000 Growth Index (composed of higher valuation companies with stronger expected earnings growth) declined 3.4% in February and is down 4.9% year-to-date.
The shift has been even more pronounced at the sector level. Technology is down 3.6% year to date, making it the second-worst performing S&P 500 sector (after financials, down 3.7%). Meanwhile, energy (up 25%), materials (up 18%), and consumer staples (up 16%) have led the market year to date. This marks a sharp reversal from 2025, when technology was the top-performing sector (ending the year up 25%) and defensive sectors, such as consumer staples, lagged (gaining only 1.6%).
A late-January sell-off in the technology sector, concentrated on software and AI-exposed names, extended into February. The pullback reflected two related concerns: first, growing skepticism over whether surging AI-related capital expenditures will generate adequate returns, and second, the disruptive potential of AI agents (a system that autonomously performs tasks by designing workflows with available tools).
Meta, Microsoft, Alphabet, and Amazon all guided to higher-than-expected capital expenditures during their fourth-quarter earnings calls held in late January and early February.13,14 Although that spending is directed toward high demand needs, such as chips, data centers, and power infrastructure, investors are increasingly scrutinizing tech companies’ efficiency and near-term profitability. Meta raised its capex outlook to roughly $115 to $135 billion, versus earlier estimates near $110 billion.13,14 Microsoft pointed to around $145 billion in 2026 capex, well above the $98 billion analysts had penciled in.13,14 Alphabet guided between $175 and $185 billion compared to expectations of $115 billion, while Amazon signaled roughly $200 billion in capex versus prior estimates near $147 billion.13,14
In early February, Anthropic launched new AI tools capable of autonomously performing coding, analysis, and workflow design.15 These developments intensified fears that AI agents could soon autonomously handle tasks that have traditionally required a human worker and that companies will therefore need fewer employees and fewer software licenses, too. If such “seat compression” occurs, software revenues could decline precipitously. Notably, Microsoft has roughly 70% exposure to software as a percentage of total revenue, Alphabet has 15% to 20% exposure, and Amazon has around 15% exposure. For now, AI’s potential impact on the software business remains uneven. Some incumbents will likely face seat-based revenue compression, while AI-native or -adaptive platforms will keep attracting capital. As a result, sectors and business models that are perceived as more resilient to AI are benefitting while those more vulnerable to AI disruption are suffering. The software sector (as proxied by the iShares Expanded Tech-Software Sector ETF) ended February down 21% year to date.
A Geopolitical Escalation
On Saturday, February 28, a joint U.S.-Israeli strike killed the Iranian Supreme Leader and other senior officials. Iran has retaliated across the region, targeting U.S. military assets and regional infrastructure.16,17 Tehran also declared the Strait of Hormuz (the critical shipping lane through which roughly 20% of global oil and 25% of LNG flows) as effectively closed.18 While the waterway cannot be physically “closed,” tanker traffic has slowed sharply amid security and insurance concerns. Then, on March 3, the White House announced that it would offer naval escorts and political risk insurance for oil and gas tankers passing through the Strait of Hormuz, but traffic through the key waterway remains near a standstill.19
Oil prices surged more than 20% between February 28 and March 3. Gold initially rallied roughly 4% before dropping lower. After an initially muted reaction, equity markets moved sharply lower on March 3. The S&P 500 declined 2.5%, and the Russell 2000 dropped 4% before paring back some losses. As of March 6, the S&P 500 was down 1.2% since the start of the conflict, while the Russell 2000 had declined 3.2%. National average gasoline prices rose 16% in the week following the start of the conflict.
Iran’s share of global oil production is relatively small, around 4%.20 As such, the disruption to the Strait of Hormuz is the largest risk from this conflict. A prolonged interruption would act as a tax on global growth, with Asia, particularly China, India, Japan, and South Korea, most exposed. Roughly 80% of Iranian oil is exported to China.21 The U.S., now a major energy producer, faces a more mixed impact: higher gasoline prices weigh on consumers, but domestic producers benefit.
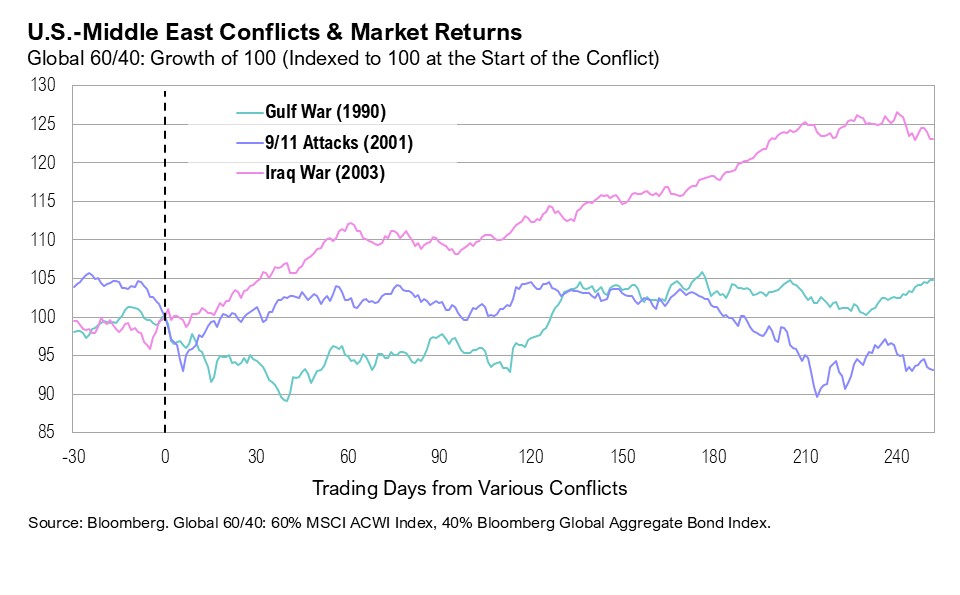
The key issue for markets is not the initial military exchange, but whether higher energy prices persist long enough to hurt global growth, inflation, or central bank policy. Historically, markets often sell off on geopolitical shocks but recover once the range of outcomes becomes clearer. Ahead of the Gulf War, which started in August 1990, the S&P 500 fell between 8% and 12% as oil prices surged and recession fears rose, but rebounded once the U.S.-led campaign began and uncertainty narrowed.22,23 Similarly, equities dropped by roughly 11% in the week after the September 11 attacks, yet recovered within months.24 Markets weakened ahead of the Iraq War, before bottoming and rallying with double-digit gains once the war commenced in March 2003.23,25
Markets
U.S. equities lagged international counterparts in February. Emerging market stocks gained 5.5%, while international developed large-cap stocks ended the month up 4.6%, and U.S. large-cap stocks declined by 0.8%. U.S. small-cap stocks outperformed their large-cap counterparts, ending the month up 0.8%. The trend was reversed in fixed income markets: U.S. intermediate-term bonds gained 1.6%, outperforming international developed market bonds, which gained 0.8% in February.
Looking Forward
Two main forces are driving the current market rotation. First, within technology, investors’ focus on AI monetization and capital efficiency, along with concerns over AI-related disruption, are prompting a re-evaluation of mega-cap growth stocks. Second, broader policy and geopolitical factors—including heightened risk, policy visibility, and a midterm-year political shift toward domestic industry and lower-income households—are supporting cyclicals, energy, and defensives. Together, these forces have driven capital away from momentum-driven growth and toward more diversified, valuation-sensitive segments of the market.
In a midterm year, markets are highly attuned to how U.S. policy responds to conflict, especially when the president’s domestic standing is already fragile and voters are focused on affordability. Recent polling shows President Trump’s approval rating in the mid-30s and only limited public support for expanded military action against Iran, with roughly one-quarter of Americans in favor and about half opposed. A prolonged conflict that drives oil and gasoline prices sharply higher for an extended period would likely be unpopular and would undercut a core political message built around lower inflation and cheaper gas, giving the administration a clear incentive to seek a quick resolution. If the conflict proves short-lived and bond yields remain contained, markets may soon refocus on solid earnings growth and an otherwise resilient economy.
Performance Disclosures
All market pricing and performance data from Bloomberg, unless otherwise cited. Asset class and sector performance are gross of fees unless otherwise indicated.
Citations
- Investing.com: https://www.investing.com/news/transcripts/citizens-financial-at-ubs-conference-strategic-expansion-and-growth-93CH-4497700
- Investing.com: https://www.investing.com/news/transcripts/bank-of-america-at-financial-services-conference-strategic-growth-and-innovation-93CH-4497668
- Federal Reserve Bank of St. Louis: https://fred.stlouisfed.org/series/CPILFESL
- Bureau of Labor Statistics: https://www.bls.gov/news.release/cpi.nr0.htm
- Bureau of Labor Statistics: https://www.bls.gov/news.release/empsit.nr0.htm
- Bureau of Economic Analysis: https://www.bea.gov/sites/default/files/2026-02/gdp4q25-adv.pdf
- U.S. Department of the Treasury: https://fiscaldata.treasury.gov/datasets/monthly-treasury-statement/summary-of-receipts-outlays-and-the-deficit-surplus-of-the-u-s-government
- Bloomberg: https://www.bloomberg.com/news/articles/2025-10-16/record-tariff-take-helps-trim-us-2025-deficit-to-1-78-trillion
- CNBC: https://www.cnbc.com/2026/02/20/supreme-court-trump-tariffs-ruling.html
- White House: https://www.whitehouse.gov/fact-sheets/2026/02/fact-sheet-president-donald-j-trump-imposes-a-temporary-import-duty-to-address-fundamental-international-payment-problems/
- Invesco: https://www.invesco.com/nl/en/insights/three-compelling-reasons-to-consider-s-and-p-500-equal-weight.html
- Liz Ann Sonders via X: https://x.com/LizAnnSonders/status/2028445324516171922/photo/2
- CNBC: https://www.cnbc.com/2026/01/27/big-tech-earnings-2026-ai-spend.html
- Bloomberg: https://www.bloomberg.com/news/articles/2026-02-06/how-much-is-big-tech-spending-on-ai-computing-a-staggering-650-billion-in-2026
- Forbes: https://www.forbes.com/sites/tylerroush/2026/02/04/global-software-stock-selloff-oracle-adobe-more-fueled-by-anthropics-new-ai-tools/
- CNBC: https://www.cnbc.com/2026/03/04/us-iran-war-live-updates.html
- Reuters: https://www.reuters.com/world/iran-war-live-israeli-strike-kills-four-lebanon-us-names-its-first-casualties-2026-03-04/
- Reuters: https://www.reuters.com/world/middle-east/iran-vows-attack-any-ship-trying-pass-through-strait-hormuz-2026-03-02/
- Bloomberg: https://www.bloomberg.com/news/articles/2026-03-03/trump-says-us-will-escort-insure-oil-tankers-amid-iran-war
- Goldman Sachs: https://www.goldmansachs.com/insights/articles/how-will-the-iran-conflict-impact-oil-prices
- Wall Street Journal: https://www.wsj.com/livecoverage/stock-market-today-oil-prices-iran-attack-03-02-2026/card/some-90-of-iran-s-crude-oil-goes-to-china-what-now–6iBeuP7YVIIs86JmR9c0
- Wall Street Journal: https://www.wsj.com/articles/SB104825716034155300
- Wall Street Journal: https://www.wsj.com/livecoverage/stock-market-today-oil-prices-iran-attack-03-02-2026/card/how-oil-prices-responded-to-previous-middle-eastern-wars-epCqnZ3ghnhVTSuT46ZZ
- Bloomberg: https://www.bloomberg.com/news/articles/2006-09-10/september-11s-lesson-for-investorsbusinessweek-business-news-stock-market-and-financial-advice
- Bloomberg: https://www.bloomberg.com/news/articles/2003-03-19/stocks-end-with-small-gains
Index Definitions
The S&P 500 Index is widely regarded as the best single gauge of the United States equity market. It includes 500 leading companies in leading industries of the U.S. economy. The S&P 500 focuses on the large cap segment of the market and covers approximately 75% of U.S. equities.
The Bloomberg Barclays U.S. Aggregate Index represents securities that are SEC-registered, taxable, and dollar denominated. The index covers the U.S. investment grade fixed rate bond market, with index components for government and corporate securities, mortgage pass-through securities, and asset-backed securities. Duration is roughly 5 years.
The Bloomberg U.S. Corporate High Yield Bond Index measures the USD-denominated, high yield, fixed-rate corporate bond market. Securities are classified as high yield if the middle rating of Moody’s, Fitch and S&P is Ba1/BB+/BB+ or below. Bonds from issuers with an emerging markets country of risk, based on the indices’ EM country definition, are excluded.
The Russell 2000® Index measures the performance of the small-cap segment of the US equity universe. It includes approximately 2000 of the smallest US equity securities in the Russell 3000 Index based on a combination of market capitalization and current index membership. The Russell 2000 Index represents approximately 10% of the total market capitalization of the Russell 3000 Index. Because the Russell 2000 serves as a proxy for lower quality, small cap stocks, it provides an appropriate benchmark for RMB Special Situations.
The U.S. Dollar Index is used to measure the value of the dollar against a basket of six foreign currencies: the euro, Swiss franc, Japanese yen, Canadian dollar, British pound, and Swedish krona.
MSCI U.S. REIT Index is a free float-adjusted market capitalization weighted index that is comprised of equity Real Estate Investment Trusts (REITs). The index is based on the MSCI USA Investable Market Index (IMI), its parent index, which captures the large, mid and small cap segments of the USA market. With 150 constituents, it represents about 99% of the US REIT universe and securities are classified under the Equity REITs Industry (under the Real Estate Sector) according to the Global Industry Classification Standard (GICS®), have core real estate exposure (i.e., only selected Specialized REITs are eligible) and carry REIT tax status.
Disclaimers
*Source: MSCI.MSCI makes no express or implied warranties or representations and shall have no liability whatsoever with respect to any MSCI data contained herein. The MSCI data may not be further redistributed or used as a basis for other indexes or any securities or financial products. This report is not approved, endorsed, reviewed or produced by MSCI. None of the MSCI data is intended to constitute investment advice or a recommendation to make (or refrain from making) any kind of investment decision and may not be relied on as such.
The opinions and analyses expressed in this newsletter are based on Curi Capital, LLC’s (“Curi Capital”) research and professional experience are expressed as of the date of our mailing of this newsletter. Certain information expressed represents an assessment at a specific point in time and is not intended to be a forecast or guarantee of future results, nor is it intended to speak to any future time periods. Curi Capital makes no warranty or representation, express or implied, nor does Curi Capital accept any liability, with respect to the information and data set forth herein, and Curi Capital specifically disclaims any duty to update any of the information and data contained in this newsletter. The information and data in this newsletter does not constitute legal, tax, accounting, investment or other professional advice. Returns are presented net of fees. An investment cannot be made directly in an index. The index data assumes reinvestment of all income and does not bear fees, taxes, or transaction costs. The investment strategy and types of securities held by the comparison index may be substantially different from the investment strategy and types of securities held by your account.