Nowhere to Hide: Q2 2022 Market Commentary

Bond investors may be in for an unwelcome surprise when they open their first quarter portfolio statements. Bonds were not the haven they’ve been in the past and declined just as much, if not more, than stocks. Looking at major indices, the Bloomberg Aggregate Bond Index was down -5.9% while the S&P 500 Index was down -4.6%.
To put first quarter bond performance in historical perspective, this was the worst calendar quarter on record for the Bloomberg US Treasury Index since its inception in 1973 with the index down -5.6%.[1]
WHAT HAPPENED?
Interest rates rose significantly, with the 10-Year U.S. Treasury Yield beginning the year at 1.5% and rising to a closing high of 2.5% before ending the quarter at 2.3%. In short, the 10-year U.S. Treasury yield was up almost 1% in a single quarter.[2]
Sustained high inflation, the U.S. Federal Reserve raising rates, and the approaching end of quantitative easing are likely causing the rise in rates. While we expected rates to head higher over time given high inflation, like many others, we were not expecting a rate rise of this magnitude over such a short period.
THREE KEY TAKEAWAYS
Retirees and conservative investors are the ones most impacted by negative bond performance, as their portfolios tend to be skewed towards fixed income rather than equities. While it’s completely understandable if investors are unnerved by first quarter portfolio statements, we believe there are three important points to keep in mind:
BOND BEAR MARKETS ARE NOT COMPARABLE TO STOCK BEAR MARKETS
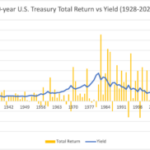
While bonds experience periods of decline, the magnitude of drawdowns tend to be significantly less than stocks. The chart below shows the 10-Year Treasury yield in blue going back to 1928. The yellow bars show the annual total return (price return + yield) for 10-Year Treasuries over the same period. The worst negative calendar year return for 10-Year Treasuries was -11.1% in 2009 during the Great Financial Crisis. On the other hand, Stocks historically have significantly worse drawdowns. Stocks were down -36.6% in 2008 for example.

Source: http://pages.stern.nyu.edu/~adamodar/New_Home_Page/datafile/histretSP.html Past performance doesn’t guarantee future results. It is possible to lose money up to your invested principal.
HISTORICALLY, BOND RETURNS HAVE BEEN POSITIVE IN RISING RATE ENVIRONMENTS
“Bond returns are generally guided by math while stock market returns are guided by emotions” – Ben Carlson, A Wealth of Common Sense.
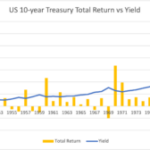
Rising rates do not equal negative bond returns. The last sustained bond bear market started in the 1940’s and did not end until 1981. The 10-Year Treasury yield rose from 2.2% in 1949 to 13.7% in 1981. Despite the significant rise in rates, 10-year treasury totals return was positive for that period and most calendar years over that time, as the chart below demonstrates.

Source: http://pages.stern.nyu.edu/~adamodar/New_Home_Page/datafile/histretSP.html Past performance doesn’t guarantee future results. It is possible to lose money up to your invested principal.
We believe the best predictor for future bond returns is the starting yield. If an investor purchases a 5-year bond at 2% and holds to maturing, the investor should expect an annualized total return of 2%.
UNREALIZED LOSSES DO NOT EQUAL PERMANENT CAPITAL LOSS
Most investment portfolios will show portfolio values have declined for the first quarter. However, these declines in portfolio value do not represent permanent loss of capital.
What’s the difference? If an investor buys a bond at $100, receives no interest and sells it immediately at $98, the investor has a permanent capital loss of $2. On the other hand, if an investor buys and holds a bond at $100 and the bond continues to pay interest until maturity, the investor does not lose capital and reaps a profit on the investment despite the temporary price decline.
Investors that hold a portfolio of bonds, bond funds, or bond ETFs have experienced a price decline in the short-term but are not permanently impaired. Yes, the price of the bonds are down, but the bonds generate the same coupon payment they did before the beginning of the year. That coupon payment represents a higher yield and future coupon payments will generate a higher yield.
WHAT CAN I DO?
- While declining market values are never enjoyable, one positive is savers can earn higher yields than they could one quarter ago. The chase for yield that many investors have pursued for over a decade is a bit easier moving forward.
- Investors can reduce portfolio interest rate risk, (known as duration) favoring bonds with shorter term maturities.
- Investors may also consider adding non-traditional fixed income and fixed income substitutes. While all investments have risks, it is possible to find investment income sources that are less sensitive to interest rate changes.
If you are interested in reviewing your portfolio, discussing potential actions, or exploring what Curi Capital can do for you, please reach out to a member of the Curi Capital team at 984-202-2800.
[1] Source: Bloomberg Finance, L.P.
[2] Source: Bloomberg Finance, L.P.
[3] Source: http://pages.stern.nyu.edu/~adamodar/New_Home_Page/datafile/histretSP.html
Please note: This material should not be considered a recommendation to buy or sell securities or a guarantee of future results. Curi Capital is a registered investment advisor. Registration does not imply a certain level of skill or training. More information about Curi Capital can be found in its Form ADV Part 2, which is available upon request.
Past performance is not a guarantee of future results. All investment strategies have the potential for profit or loss; changes in investment strategies, contributions, or withdrawals may materially alter the performance and results of a portfolio. Different types of investments involve varying degrees of risk, and there can be no assurance that any specific investment will be suitable or profitable for a client’s investment portfolio. An index is unmanaged and not available for direct investment.
Index Descriptions
S&P 500 Index – a market capitalization-weighted index, composed of 500 widely held common stocks, including reinvestment of dividends, that is generally considered representative of the US stock market.
Bloomberg Aggregate Bond Index – an index comprised of approximately 6000 publicly traded bonds, including US Government, mortgage-backed, corporate, and yankee bonds with an approximate average maturity of 10 years.
Bloomberg US Treasury Index – an index that measures US dollar-denominated, fixed-rate nominal debt issued by the US Treasury. Treasury bills are excluded by the maturity constraint.


