
Summary
- Investors were dealt a mixed hand in the third quarter as U.S. large-cap stocks, measured by the S&P 500 Index, gained 2.3%, while the small-cap Russell 2000 Index declined 7.2%.
- The Bloomberg Municipal 1-10 Year Blend Index ended the quarter down 4.1%, including a 3.4% decline in September, bringing its year-to-date returns to -3.1%. September marked the index’s worst month on record, which goes back to 1993.
- Personal spending rose a remarkable 0.9% in August, well ahead of income growth of 0.2%, even as the Conference Board’s Consumer Confidence Index fell to its lowest level since 2014.
- With second-quarter reporting complete, the S&P 500 posted earnings growth of 52%, the strongest since the second quarter of 2021, along with record net profit margins of 17%.
- Seasonality following midterm elections remains the most potentially bullish wild card.
Overview
Investors were dealt a mixed hand in the third quarter as U.S. large-cap stocks, measured by the S&P 500 Index, gained 2.3%, while the small-cap Russell 2000 Index declined 7.2%. Through the first nine months of 2026, the S&P 500 is up 12.8%, and the Russell 2000 is up 13.7%. The MSCI EAFE Index rose 0.9% in the third quarter and has been flat since the start of the Iran conflict, trailing the S&P 500 by 11.2% over that period. U.S. intermediate-term bonds, proxied by the Bloomberg U.S. Aggregate Bond Index, fell 3.5% in the third quarter, bringing their year-to-date return to -2.9%. If the yearly negative return were to hold, 2026 would mark only the sixth calendar-year loss for the Bloomberg U.S. Aggregate Index since its inception in 1976.
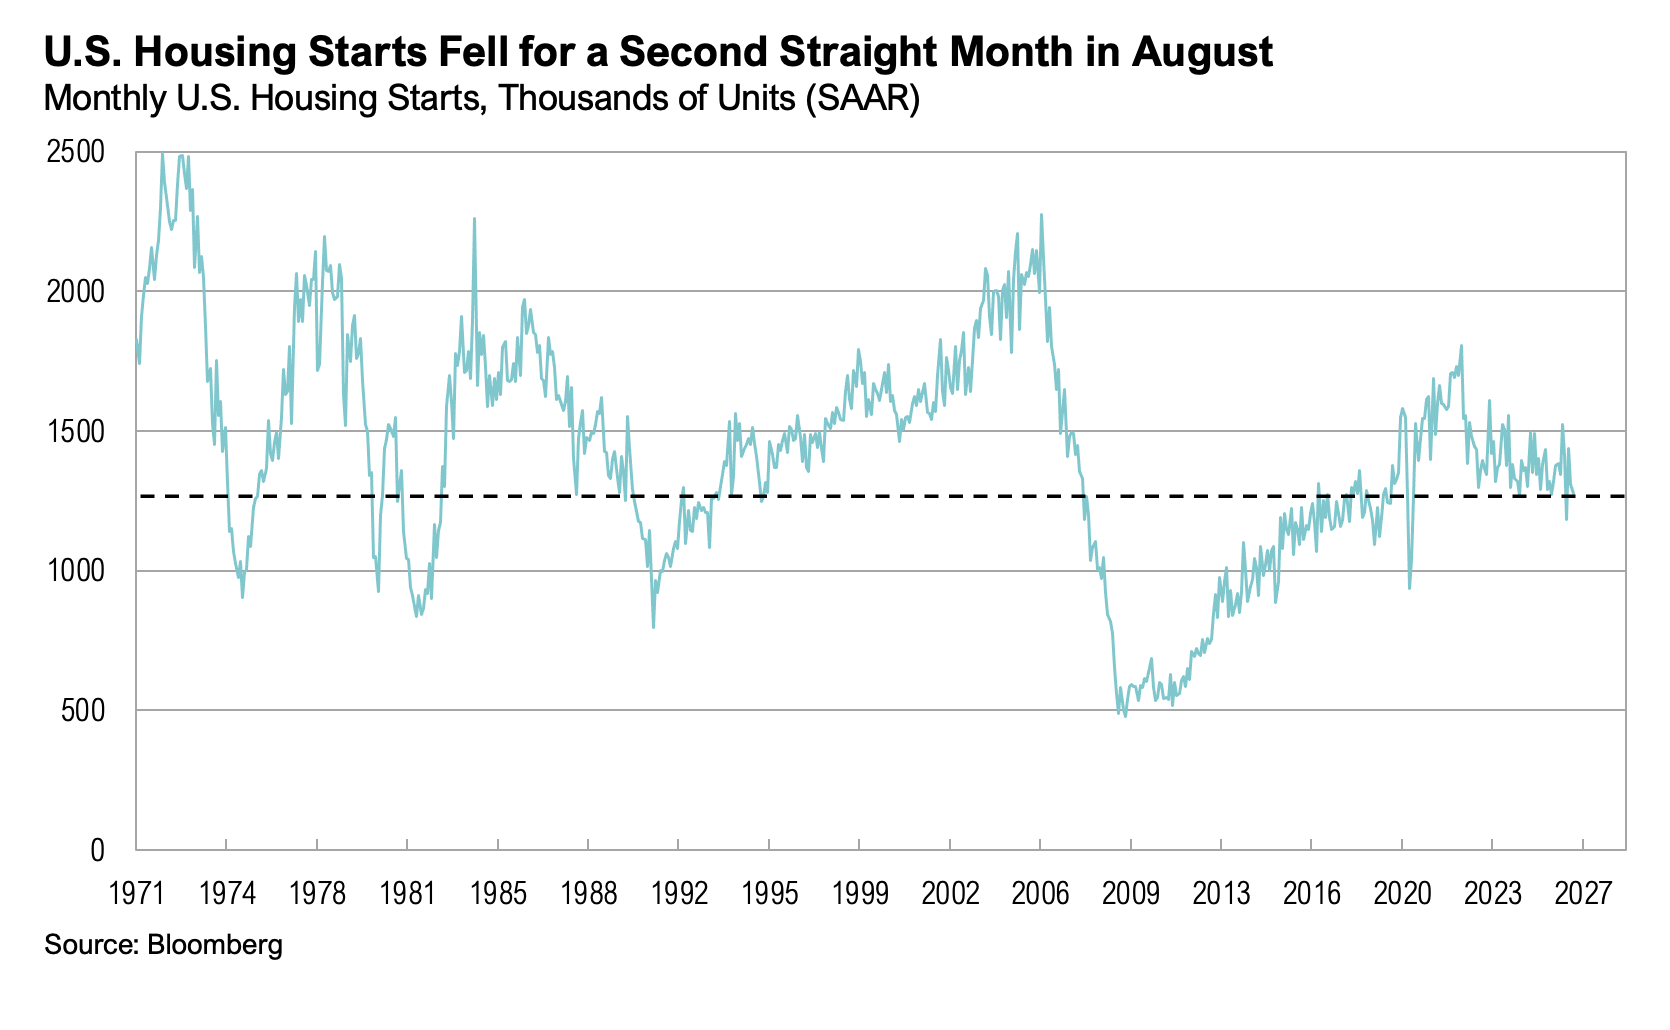
Second-quarter real GDP was revised up to 2.2% annualized from an initial estimate of 1.5%, driven by stronger investment, consumer spending, and government spending. Second-quarter nominal GDP grew at an 8.5% annualized rate, its fastest pace since 2006 outside the post-COVID recovery.1 Business investment, led by the AI buildout, remained the primary driver of growth, with non-residential investment rising 9.0% in the second quarter. Housing, by contrast, remains weak under the current economic and interest rate environment. Residential investment rose a modest 2.8% in the second quarter after declining in the previous quarter. Housing starts dropped 12.4% in July before falling further in August to a seasonally adjusted annual rate of 1.3 million.1, 2
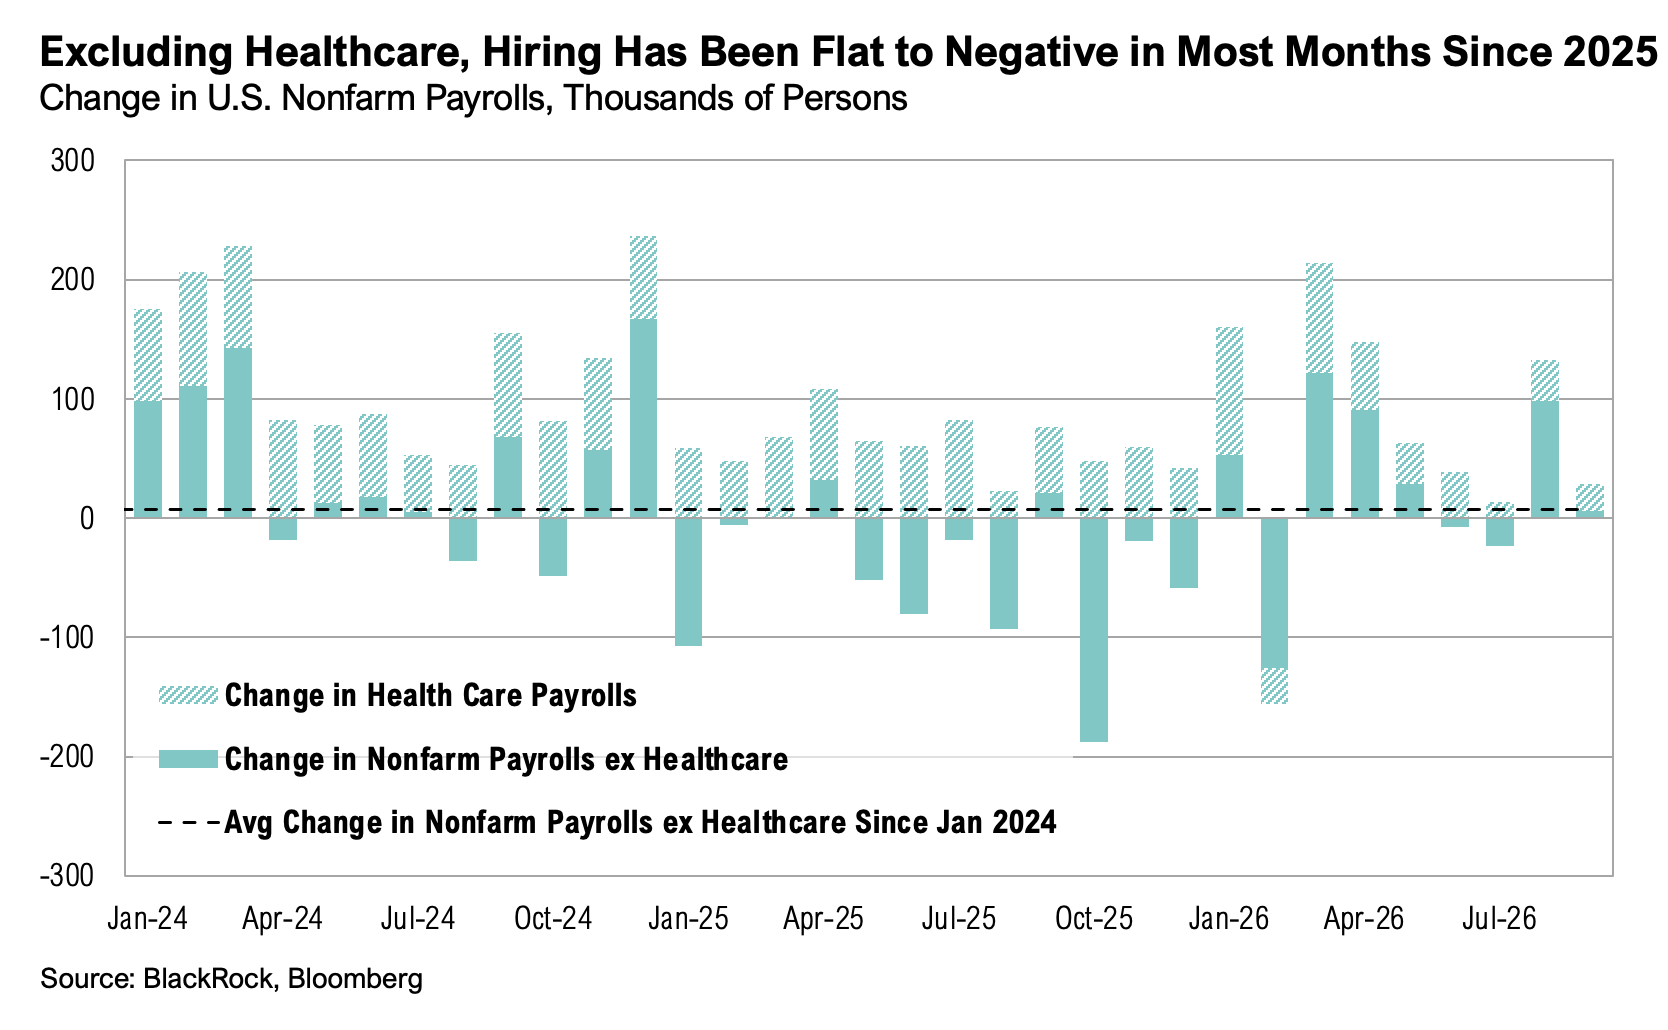
The labor market continued to produce lackluster job growth, a trend that started in 2024. Over the course of the third quarter, just 152,000 jobs were added.3 Since the start of 2024, nonfarm payrolls excluding healthcare have risen by an average of just 7,000 per month, compared with 66,000 for total payrolls, and the hiring rate has fallen to its lowest level since 2010.4, 5 Wage growth cooled to 3.1% year over year in August, below the 3.4% headline inflation rate, which leaves less room for real income growth to support consumer spending.3, 6
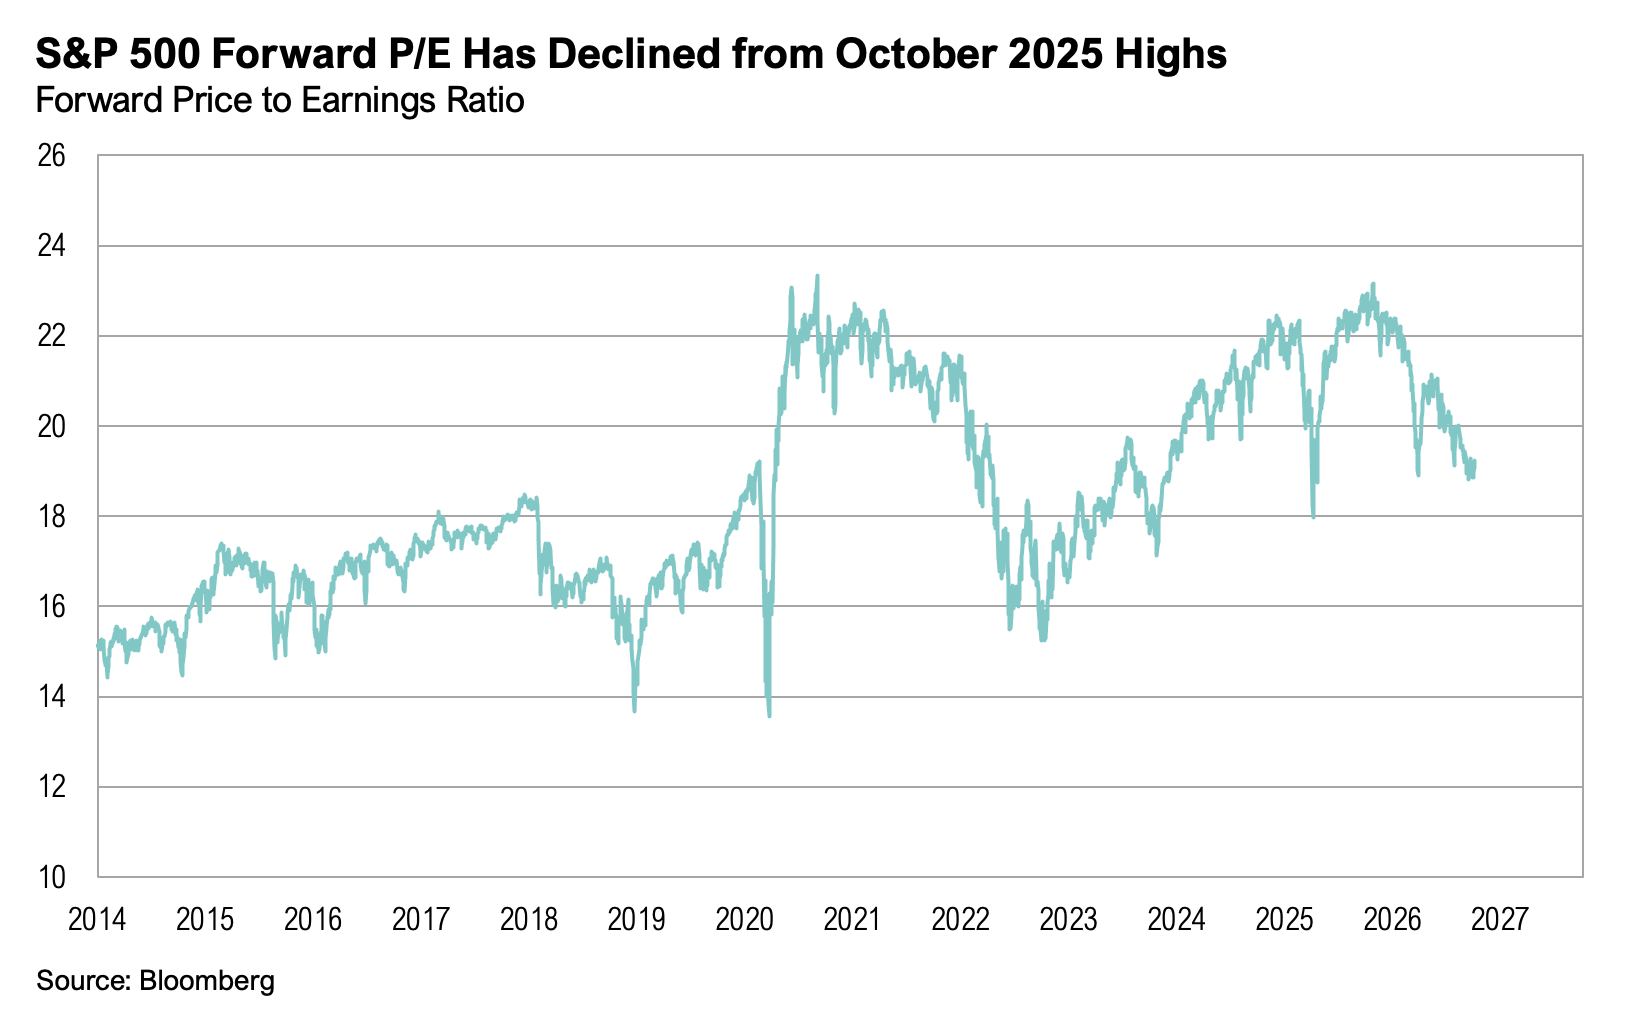
With second-quarter reporting complete, the S&P 500 posted earnings growth of 52%, the strongest since the second quarter of 2021, along with record net profit margins of 17%. Third-quarter growth is now expected to reach 30%, up from the estimate of 27% growth in June. Full-year earnings are projected to grow 32% in 2026, the highest growth rate since the 47% generated in 2021, and 16% in 2027.7 The forward P/E ratio for the S&P 500 has fallen from 20.4 at the end of June to 18.9 at the end of September, which is below both its five- and ten-year averages.
Software stocks recovered in the third quarter, rebounding more than 45% from their April lows to turn positive for the year, led by cybersecurity and strong AI-driven results from companies like Salesforce.8 Meta shares, which fell after second-quarter earnings amid concerns over rising capex and an unclear path to AI returns, rallied 38% from mid-August following the successful launch of its Muse AI agent. Outside of AI, however, interest-rate-sensitive and consumer-oriented areas of the market lagged behind the rest of the market during the quarter. While the S&P 500 increased 2.3%, consumer discretionary stocks fell 7%, and regional banks declined nearly 8%, as higher interest rates weighed on both groups. Within consumer discretionary, homebuilders and housing-related stocks fell 17% as mortgage rates climbed and existing home sales slowed to their lowest pace in more than a year.9
Wild Cards
After a late-July exchange of strikes between the U.S. and Iran, a renewed ceasefire in early August briefly pushed oil back below $78 per barrel, but the relief was short-lived. Tanker traffic through the Strait of Hormuz remains disrupted, recovering only briefly in June, and in September drone strikes forced Saudi Arabia’s East–West pipeline offline, closing the last major route around the strait.10 WTI crude climbed back above $100 per barrel and ended the quarter over 30% higher, even as the U.S. carried out a record-fast release from the Strategic Petroleum Reserve.11 Disruptions to Middle Eastern refining and Ukrainian strikes on Russian refineries also tightened global fuel supply, sending diesel to a record $6.53 per gallon in late September before it ended the month at $6.38, roughly 67% higher than pre-conflict levels.12
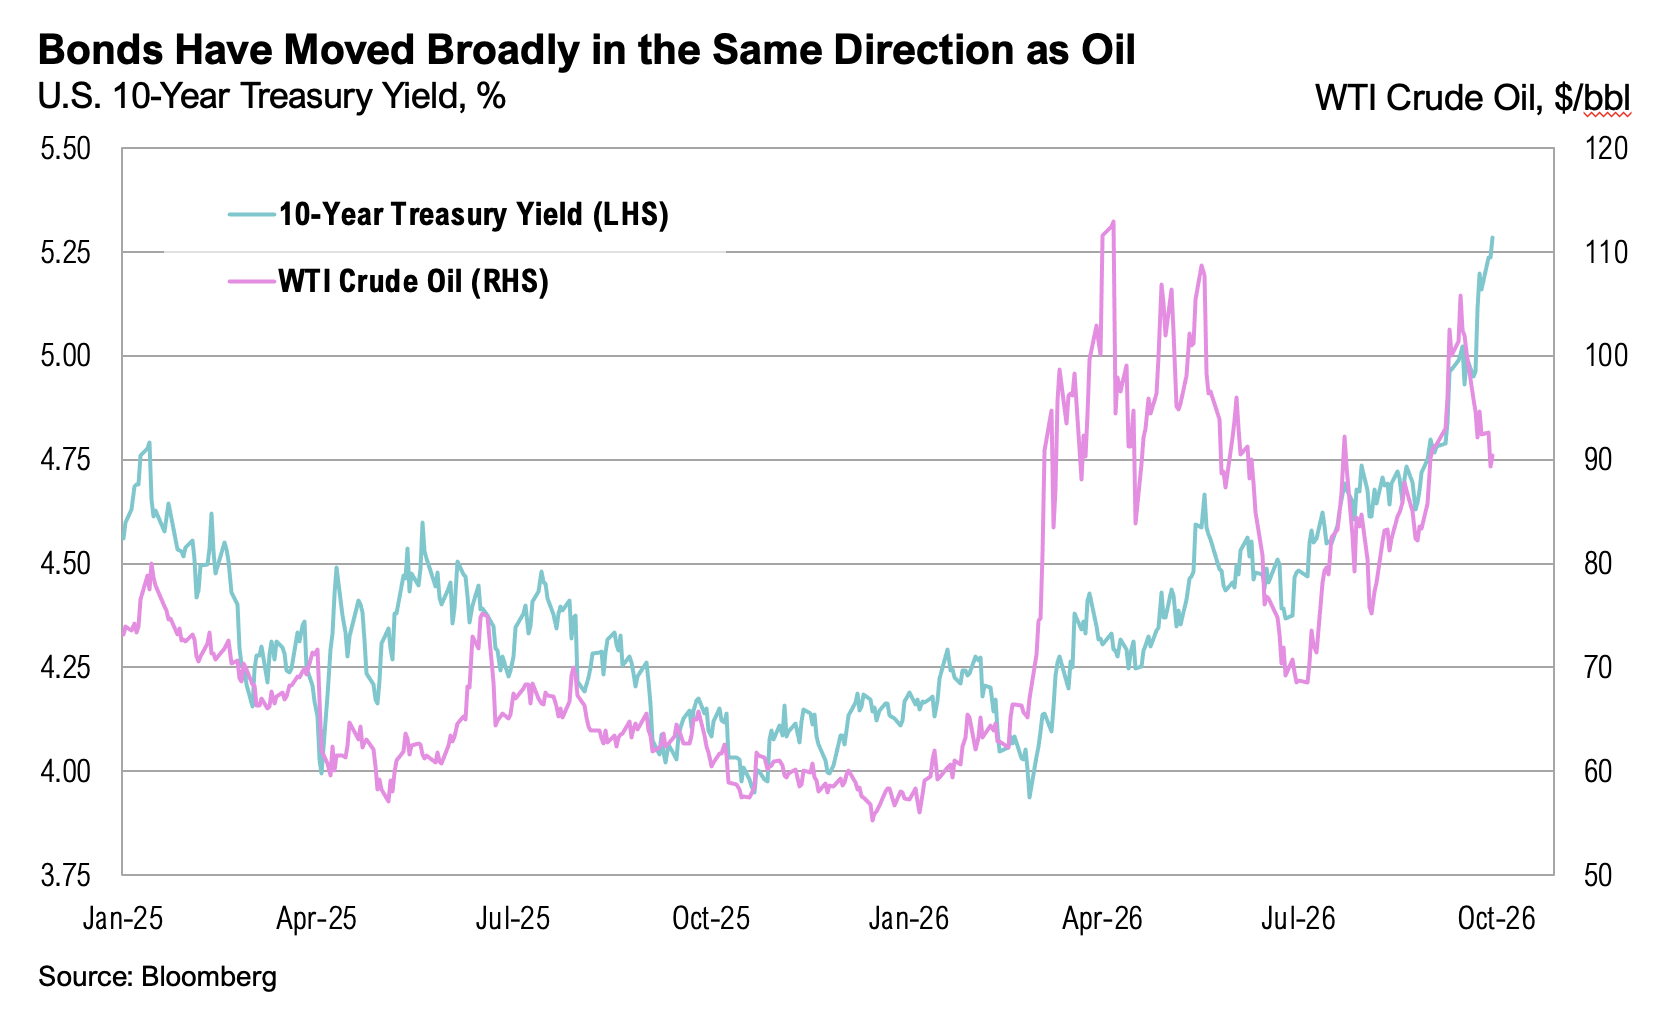
Higher energy prices have been the primary driver of the pickup in inflation this year. Headline CPI rose from 2.4% in February to a peak of 4.2% in May and has since eased to 3.4%, while core inflation, which excludes food and energy, remained at 2.4%. Energy accounted for more than 30% of headline inflation over the past year, despite making up only 6% of the consumer price basket.6 Treasury yields have tended to move alongside oil prices, reflecting the role energy has played in shaping the inflation outlook. For the quarter, the 10-year Treasury yield rose from 4.44% to 5.29%, and is now 134 basis points above where it stood when the Iran conflict began.
Higher long-term rates are weighing visibly on housing. The 30-year fixed mortgage rate reached 7.45%, its highest level since April 2024, and existing home sales fell for the third straight month in August to an annual pace of 3.98 million, the lowest since June 2025. That is well below the roughly 5.3 million homes sold annually before the pandemic.9, 13
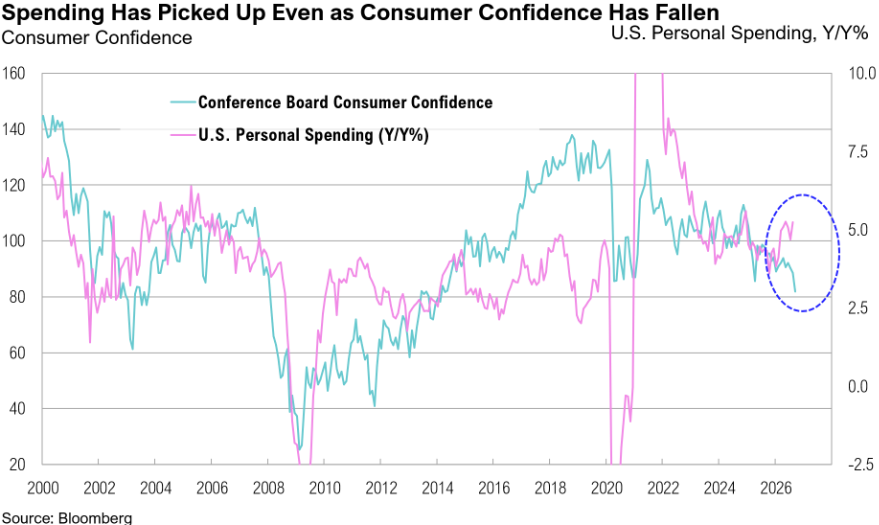
Consumer spending has shown remarkable resilience, though the picture beneath the surface is less comfortable. Personal spending rose 0.9% in August, well ahead of income growth of just 0.2%, even as the Conference Board’s Consumer Confidence Index fell to its lowest level since 2014.14, 15 Households are increasingly drawing on savings to fund that spending, pushing the personal saving rate down to 4.1%, its lowest level since 2022. Higher energy prices have weighed heavily on sentiment, even though U.S. households are better insulated than in past energy shocks. Household spending on energy has risen to only about 3.8% of disposable income, well below the peaks of roughly 8% in 1980 and 6% in 2008.14
At its July meeting, the Federal Open Market Committee held rates steady, but three members dissented in favor of a hike.16 Federal Reserve Chair Kevin Warsh attributed the hold to the bond market doing the Fed’s work for it. He argued that higher Treasury yields had already tightened financial conditions, reducing the immediate need for another rate increase.16 At Jackson Hole in August, Warsh described the economy as fundamentally healthy but said progress on inflation remained incomplete. He also reaffirmed his view that short-term interest rates, not balance-sheet tools like quantitative easing, should be the Fed’s primary instrument.17 In September, with inflation above the Fed’s 2% target for 66 consecutive months, the Fed raised rates by 0.25 percentage points to a range of 3.75% to 4.00%.6 The decision was unanimous and marked the first rate hike since 2023. In the FOMC press conference, Warsh noted this move was in part a reversal of the 2024 interest rate cuts:
“I would be hard pressed to describe broad financial conditions as restrictive. This view was widely shared by the Committee. So [they] removed a dose of accommodation.”18
The decision reflects the Fed’s renewed focus on inflation, supported by its assessment that the labor market remains sufficiently resilient to absorb higher rates. Warsh pointed to robust business investment and resilient hiring as evidence the economy can handle higher rates. On the labor market, Warsh noted:
“The jobless rate remains low at around 4.1 percent, and both job openings and weekly hours have been increasing. Unemployment claims, on a four-week moving average, are running at levels consistent with full employment.”18
Markets
The S&P 500 Index fell 0.4% in September, outperforming the MSCI EAFE Index, which fell 3.0%. U.S. intermediate-term bonds fell 3.5% for the quarter, including a 2.6% decline in September, bringing year-to-date returns to -2.9%. Municipal bonds fared notably worse. The Bloomberg Municipal 1-10 Year Blend Index ended the quarter down 4.1%, including a 3.4% decline in September, bringing year-to-date returns to -3.1%. September marked the index’s worst month on record, which goes back to 1993. This follows a March decline that ranked as the 11th-worst on record, matching the index’s return in September 2008, during the Global Financial Crisis.
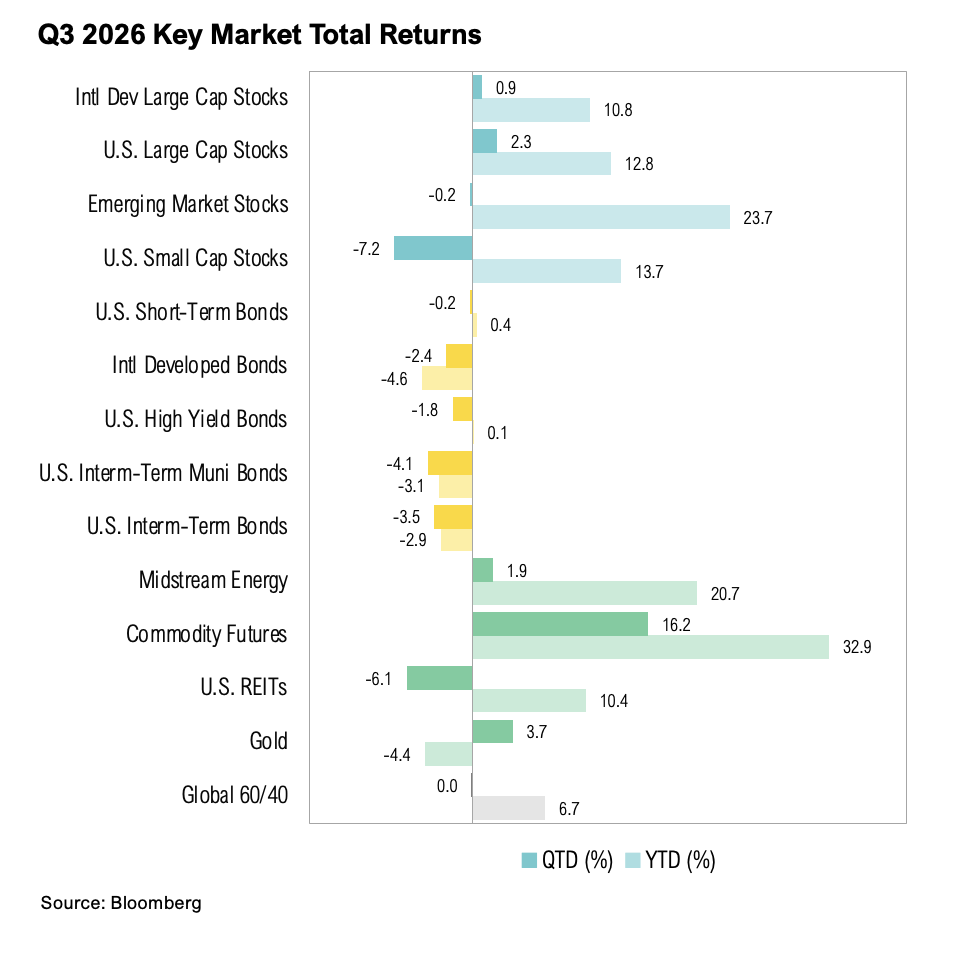
Energy stood out as a top-performing area of the market, driven by ongoing supply disruptions in the Middle East. Brent crude rose 42%, and WTI crude rose 30%. These gains continued throughout the quarter: in September alone, Brent climbed 14% and unleaded gasoline 8%. Bitcoin also posted strong gains, rising 43% for the quarter, including 5.9% in September.21 Bitcoin’s strong quarter narrowly beat its third-quarter 2013 return of 41%, making this its second-best third quarter on record, behind only the 80% generated in the third quarter of 2017. Crypto policy developments during the quarter were mixed. The CLARITY Act stalled after failing a key Senate procedural vote in September, but days later, the SEC issued a five-year “Innovation Exemption,” which allows on-chain trading of tokenized U.S. stocks.19, 20
Looking Forward
Corporate earnings dealt investors a strong hand in the third quarter, but a series of wild cards, from an escalating energy shock to the Fed’s first interest rate hike since 2023, kept market participants from going all in. Longer-term interest rates remain particularly important to economic activity and market valuations, influencing borrowing costs across the economy and the discount rates applied to financial assets. The sharp rise in Treasury yields this quarter reflects renewed inflation pressures, stronger nominal growth, and an increasingly challenging fiscal backdrop. While short-term rates remain closely tied to Fed policy, longer-term rates must also absorb Treasury supply and shifting expectations for inflation and economic growth.
As we enter the final quarter of 2026, another wild card emerges: the midterm elections. Beyond their implications for congressional control and legislation during the final two years of the Trump administration, the results will offer insight into the political climate and voter priorities heading into the next presidential election. This period also ushers in a historically favorable seasonal window for equities. From October of a president’s second year through April of the third year, stock market gains have historically annualized at nearly three times their long-term average.22
Performance Disclosures
All market pricing and performance data from Bloomberg, unless otherwise cited. Asset class and sector performance are gross of fees unless otherwise indicated.
Citations
- Bureau of Economic Analysis: Gross Domestic Product | U.S. Bureau of Economic Analysis (BEA)
- U.S. Census Bureau: New Residential Construction Press Release
- Bureau of Labor Statistics: https://www.bls.gov/ces/
- BlackRock Fixed Income, September 2026: “Asking the Right Questions.”
- Bureau of Labor Statistics: https://www.bls.gov/jlt/
- Bureau of Labor Statistics: https://www.bls.gov/cpi/
- FactSet: FactSet Earnings Insight
- Salesforce: Q2 FY27 Quarterly Investor Deck
- National Association of Realtors: https://www.nar.realtor/newsroom/nar-existing-home-sales-report-shows-2-0-decrease-in-august
- CNBC: Saudi Arabia shut down East-West crude oil pipeline after multiple attacks by drones from Iraq
- EIA: Weekly U.S. Ending Stocks of Crude Oil in SPR (Thousand Barrels)
- Federal Reserve Bank of St. Louis: US Diesel Sales Price (GASDESW) | FRED | St. Louis Fed
- Mortgage News Daily: 30 Year Fixed Mortgage Rates – National Average
- Bureau of Economic Analysis: https://www.bea.gov/data/income-saving/personal-income
- The Conference Board: https://www.conference-board.org/topics/consumer-confidence/index.cfm
- Federal Reserve: https://www.federalreserve.gov/mediacenter/files/FOMCpresconf20260729.pdf
- Federal Reserve: https://www.federalreserve.gov/newsevents/speech/warsh20260828a.htm
- Federal Reserve: https://www.federalreserve.gov/mediacenter/files/FOMCpresconf20260916.pdf
- CNBC: Senate cloture vote on Clarity Act fails, dealing regulatory blow to crypto industry
- SEC: SEC.gov | SEC Issues “Innovation Exemption” to Facilitate the Trading of Tokenized NMS Stock and Request for Comment
- Pan, D. (2026, October 5). Strategy Returns to Profitability on $21 Billion 3Q Gain. Bloomberg. https://www.bloomberg.com/news/articles/2026-10-05/strategy-returns-to-profitability-on-21-billion-unrealized-gain
- Hirsch, J. A. (2026). Stock Trader’s Almanac 2027. John Wiley & Sons.
Index Definitions
The S&P 500 Index is widely regarded as the best single gauge of the United States equity market. It includes 500 leading companies in leading industries of the U.S. economy. The S&P 500 focuses on the large cap segment of the market and covers approximately 75% of U.S. equities.
The Bloomberg Barclays U.S. Aggregate Index represents securities that are SEC-registered, taxable, and dollar denominated. The index covers the U.S. investment grade fixed rate bond market, with index components for government and corporate securities, mortgage pass-through securities, and asset-backed securities. Duration is roughly 5 years.
The Bloomberg US Aggregate Bond Index (known as “the Agg”) is a flagship, market capitalization-weighted benchmark for the U.S. investment-grade, taxable fixed-income market.
The Bloomberg 1–10 Year Blended Municipal Bond Index is a market index of high quality, domestic fixed income securities with maturities of less than 10 years.
The Conference Board Consumer Confidence Index is a monthly economic indicator that measures how optimistic or pessimistic U.S. consumers are about the overall state of the economy and their own personal financial situations.
The Russell 2000® Index measures the performance of the small-cap segment of the US equity universe. It includes approximately 2000 of the smallest US equity securities in the Russell 3000 Index based on a combination of market capitalization and current index membership. The Russell 2000 Index represents approximately 10% of the total market capitalization of the Russell 3000 Index.
The MSCI EAFE Index is an equity index which captures large and mid cap representation across Developed Markets countries around the world, excluding the US and Canada. The index covers approximately 85% of the free float-adjusted market capitalization in each country.
Disclaimers
*Source: MSCI.MSCI makes no express or implied warranties or representations and shall have no liability whatsoever with respect to any MSCI data contained herein. The MSCI data may not be further redistributed or used as a basis for other indexes or any securities or financial products. This report is not approved, endorsed, reviewed or produced by MSCI. None of the MSCI data is intended to constitute investment advice or a recommendation to make (or refrain from making) any kind of investment decision and may not be relied on as such.
The opinions and analyses expressed in this newsletter are based on Curi Capital, LLC’s (“Curi Capital”) research and professional experience are expressed as of the date of our mailing of this newsletter. Certain information expressed represents an assessment at a specific point in time and is not intended to be a forecast or guarantee of future results, nor is it intended to speak to any future time periods. Curi Capital makes no warranty or representation, express or implied, nor does Curi Capital accept any liability, with respect to the information and data set forth herein, and Curi Capital specifically disclaims any duty to update any of the information and data contained in this newsletter. The information and data in this newsletter does not constitute legal, tax, accounting, investment or other professional advice. Returns are presented net of fees. An investment cannot be made directly in an index. The index data assumes reinvestment of all income and does not bear fees, taxes, or transaction costs. The investment strategy and types of securities held by the comparison index may be substantially different from the investment strategy and types of securities held by your account.